Download
1 / 21
210 likes | 320 Views
Lidar wind measurements in the Southeastern Pacific lower troposphere: stratus versus clear conditions. Sara C. Tucker, Wm. Alan Brewer, Scott Sandberg, Mike Hardesty CIRES, University of Colorado and NOAA/ESRL/CSD

E N D
Lidar wind measurements in the Southeastern Pacific lower troposphere: stratus versus clear conditions Sara C. Tucker, Wm. Alan Brewer, Scott Sandberg, Mike HardestyCIRES, University of Colorado and NOAA/ESRL/CSD With thanks to Dan Wolfe and other scientists and crew of the RHB TexAQS and VOCALS cruises Working group on space-based winds January 27-30, 2009 Destin, FL
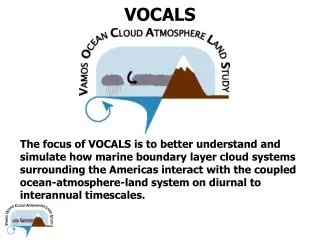
HIGH RESOLUTION DOPPLER LIDAR (HRDL) – VOCALS VOCALS 2008: The VAMOS Ocean-Cloud-Atmosphere-Land Study Regional Experiment VAMOS : Variability of the American Monsoon Systems • A study in the region of the Southeastern Pacific to improve understanding of: • the processes controlling properties of stratocumulus clouds and ocean transport of cold fresh water offshore, • aerosol, drizzle, cloud interactions, and • the chemical and physical interactions between ocean, atmosphere, and land.
HRDL RV Brown – VOCALS 2008 • Ship-based studies help to characterize wind (horizontal wind profiles and vertical winds) and scattering over the oceans • Arctic (IPY) cruise Southeastern Pacific • Data in the tropics and down near -21 South • Lidar, cloud radar (w-band), c-band, flux tower, sondes, & lots of oceanography (Buoys 101)
Low elevation conical High elevation conical Elevation scans Zenith 2 micron backscatter intensity 0 Scan pattern repeated every 20 minutes Vertical Velocity 10 40 20 VOCALS 2008: Ship locations and HRDL scans
Horizontal mean wind speed & direction Atmospheric Studies with the NOAA/ESRL High Resolution Doppler Lidar (HRDL) Dynamical • Profiles of horizontal wind speed and direction and small scale σw2 • Turbulence strength and mixing height • Rolls, outflows/convergence, divergence, etc. • Atmospheric decoupling • Cloud base velocity Aerosol Backscatter • Aerosol layers • Spatial variability in vertical and horizontal planes • Cloud base height and cloud fraction • Atmospheric decoupling Wideband SNR (proxy for backscatter) Vertical velocity variance, σw2
HRDL - RV Brown, VOCALS 2008: Horizontal mean wind direction HRDL - RV Brown, VOCALS 2008: Horizontal mean wind speed
HRDL VOCALS Wind Roses • at 20, 300, 800, and 1200 m alts. • Distributions of: • wind direction (outline) • and of • speed in each directional bin (distribution displayed using color intensity). 20 m 300 m 1200 m 800 m
VOCALS 2008: HRDL SNR and clouds HRDL RV Brown VOCALS 2008 – 20 min Zenith wbSNR 10/21/08-11/30/08 dB In port • Stratus deck over much of the Southeastern Pacific • During VOCALS: ~90% cloud cover (according to HRDL signals)
Are MBL winds different under stratus vs. under “clear sky”?
HRDL VOCALS: Distributions of horizontal mean wind speed and direction vs. altitude
HRDL VOCALS: Statistics of horizontal mean wind speed and direction vs. altitude
Differences in observed statistics Cloud deck wind stats - Scattered/No Cloud wind stats Lowest ~500 m wind speed averages are slightly lower under the stratus deck Lowest ~500 m wind direction averages are more southerly under the stratus deck Not huge differences but…
Implications of SEP cloud cover for use of future Space-Based Wind Lidar data • What will this mean for models? • Weather forecasting • Aerosol transport (smelters, fires, etc.) • Aerosol generation (sea-salt): winds/turbulence/waves • Aerosol/cloud interactions (winds/turbulence) • Still need to factor in vertical winds during clear periods • Would buoy (surface) data suffice for some applications? Surface wind speeds are almost always lower than those aloft. • Combine with other types of satellite (i.e. Scatterometer, visible imagery) data?
HRDL – VOCALS 2008: Cloudy vs. cloud-free vertical profiles HRDL zenith signal strength (relative aerosol backscatter) Cloud layer Mean horizontal wind profiles HRDL vertical velocity Mixing was typically shallower and weaker during scattered/cloud-free periods - usually due to less cloud-top-cooling-driven convection and less air-sea temperature difference.
HRDL – VOCALS 2008: turbulence & decoupling underneath clouds HRDL zenith signal strength (relative aerosol backscatter) Cloud layer Mean horizontal wind profiles HRDL vertical velocity Cool colors falling air/particles Warm colors rising air How representative of cloud particles are the in-situ surface measurements?
Just getting started… • Impact of vertical velocities • Vertical transport (etrainment & venting) • Mixing heights • Aerosol layer(s) • Relationship between MBL winds & SST • Higher temporal resolution cloud height, % cloud cover, & time of day • Model implications Thanks to NASA, NOAA/CPPA and NOAA/HOA for funding this work
0200-0300 UTC ~9 pm local HRDL VOCALS: Cloud height vs. Mixing Height and observations of decoupling Mixing heights to come – to be compared to cloud base from ceilometer