Download
1 / 60
660 likes | 955 Views
2008. Iran at a Glance. EXIT. Key Indicators. Persian Gulf. Source: Central Bank of Iran, Iran Customs Dept.,IMF * Estimate. EXIT. Key Indicators. Iran with a GDP worth $ 817 billion (based on Iranian Rial purchase power against us dollar) and

E N D
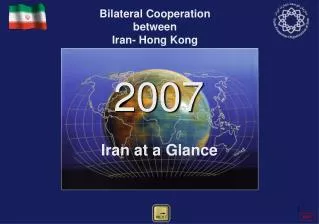
2008 Iran at a Glance EXIT
Key Indicators Persian Gulf Source: Central Bank of Iran, Iran Customs Dept.,IMF * Estimate EXIT
Key Indicators • Iran with a GDP worth $817billion(based on Iranian Rial purchase power against us dollar) and • over a $ 153 billion in Foreign Trade volume in year 2008 is one of the economic powers and large markets in the Middle-East region. • Iran has extra ordinary expansion and investment potentials in the fields of Oil, Gas, Petrochemicals, Mines, Industries, Agriculture and Service sectors. EXIT
Key Indicators • Iran ranks 4th on Diversity of Agricultural Products in the world. • Iran holds 4th to 9th rank in the production of Zinc, Lead, Cobalt, Aluminum, Manganese, Copper in the world. • 303 Techno-Engineering projects have been executed in 42 countries by Iranian companies over the last 10 years. EXIT
Key Indicators • Industrial commodities make up about 57% of Non-oil export. • Import structure consists of 16.2% capital, 65.2% intermediated, 9.9% consumer goods. • Iran holds the 7th standing in tourist attractions however, has little share in the trade of world tourism EXIT
Trade Strategies EXIT
Goals & Objectives Increasing the Country’s Stake in the International Trade Proactive Interaction with the Global Economy Competition & Anti-trust Policies Renovation of National Commercial Systems EXIT
Goals & Objectives 1. Trade Facilitation 2. Development of Foreign Trade & Non - Oil Export Promotion 8. Restructuring & Improving Human Resources Goals & Objectives 7. Targeted Subsidies 3. Active Participation In Regional Blocks 4. E-Commerce Development 6. Local Market Regulating 5. Distribution Channels Productivity Upgrading EXIT 2
Goals & Objectives 1. Trade Facilitation • Rationalizing Tariff System & Anti-Dumping Measures • Non-Official Trade Reduction • Implementing Preferential Tariff Agreements • Trade Balance Improvement • Developing Trade & Economic Cooperation EXIT
Goals & Objectives 2. Development of Foreign Trade Non-Oil Export Promotion • Sectoral Export Strategy Formulation • Promoting Export of Goods & Services • Expansion & Diversification of Export Markets • Infrastructure Development & Upgrading Service Delivery EXIT
3. Active Participation in Regional Blocks Goals & Objectives • Managing Iran Accession to WTO & Minimizing it’s probable adverse effects • Preparation of Economic Social & Cultural Sectors of Iran for Accession to WTO • Iran Active Participation International & Regional Blocks and Organizations EXIT
Goals & Objectives 4. E-Commerce Development Establishing Required Infrastructure for E-Commerce Promotion Development of New Technologies in Trade Sector Designing and Integrating Trade Information Systems EXIT
Goals & Objectives 5. Distribution Channels Productivity Up-grading • Improvement & Development of Trade Logistics • Re-engineering of Distribution Sub-Sector of the country • Clusters & Production Networks Promotion in the country • Private Sector Investment Attraction & Promotion in Trade Sector EXIT
Goals & Objectives 6. Local Market Regulating • Strategic Goods Local Market Regulating • Consumer Rights Protection & Market Surveillance EXIT
Goals & Objectives 7. Targeted Subsidies Strategic Goods Subsidy System Improvement Monitoring Strategic Goods Distribution EXIT
Goals & Objectives 8. Restructuring & Improving Human Resources • Management Development • Re-Structuring & Re-Engineering in Trade Sector • Promotion of establishing NGO’s for down-sizing of Government • Process Improvement, Procedures and technology Development • Customer Orientation EXIT
Potential Export EXIT
Potential Export Products & Services mAgriculture Sector: - Agricultural & Horticultural Products - Poultry, Husbandry & Fisheries Products m Industry Sector: - Food and Beverage - Textile & Leather - Construction Materials - Chemical Products - Fur Products - Plastic , Melamine Ware - Iron, Steel & Metal Ores - Refined Petrochemical Products - Pharmaceutical, Hygienic, Cosmetic Products - Transportation Equipment, Vehicles & Parts EXIT
Potential Export Products & Services mMines Sector: - Metal Mines - Non-Metal Mines m Services Sector: - Tourism - Technical & Engineering - Financial & Banking - Information Technology - Health Care Services - Labor Force - Transportation & Transit mHandicrafts Sector: - Hand Knotted Carpets - Handicrafts (other) EXIT
Potential Export Comparative Advantage of Agriculture EXIT
Comparative Advantage of Agriculture • According to FAO, the principal structure of the world agriculture products is composed of 66 different products and Iran is among the top 10 countries producing 15 types of these products in the world • Iran ranks 4th on Diversity of Agricultural products in the world • Cultivated Lands (about 14 millions of hectares) • 4 Season Products EXIT
Comparative Advantage of Agriculture • Continental Climate: • - Different types of climates • - Significant differences in temperature between: • Different Regions of the country • Different Seasons • Day & Night (sharp difference) - 12000 Different Species of Plants • - Average number of Sunny Days (300 Days) EXIT
Husbandry Sheep Goat Source: FAO EXIT
Crops Primary Source: FAO EXIT
Crops Primary Source: FAO EXIT
Potential Export Comparative Advantage of Mine & Industry EXIT
Mineral Reserves EXIT
Potential Export Mine & Industry Sector: - Food and Beverage - Textile & Leather - Construction Materials - Chemical Products - Fur Products - Plastic , Melamine Ware - Iron, Steel & Metal Ores - Refined Petrochemical Products - Pharmaceutical, Hygienic, Cosmetic Products - Transportation Equipment, Vehicles & Parts - Metal Mines - Non-Metal Mines EXIT
Petrochemical Industry Source: National Petrochemical Company EXIT
Petrochemical Industry Source: National Petrochemical Company EXIT
Petrochemical Industry Source: National Petrochemical Company EXIT
Petrochemical Industry Source: National Petrochemical Company EXIT
Potential Export Technical & Engineering Services EXIT
Consulting & Contracting Firms • Dams, Tunnels, Bridges, Irrigation, Drainage & Waste Water Treatment • Power Lines & Power Plants • Electronics Industry & Information Technology • Telecommunications Equipment • Industrial Factories and Installations • Machinery Design & Refinery Equipment EXIT
Export Projects 2008 EXIT
Export Markets 2008 EXIT
Export Markets 1994-2008 Belarus Kazakhstan Azerbaijan Kyrgyzstan Uzbekistan Armenia Albania Turkmenistan Turkey Tajikistan Syria Afghanistan Cyprus Iraq Morocco Lebanon Kuwait Pakistan Libya Qatar India UAE Oman Bangladesh Saudi Arabia Niger Djibouti Yemen Sudan Benin Senegal Venezuela Zimbabwe 1994-2008 EXIT
2008 EXIT
2008 EXIT
Foreign Trade Export & Import EXIT
Trends of Export & Import Value: $US Billion Iran’s Export Iran’s Import Source: Central Bank of I.R. Iran * Estimate EXIT
Trade by Regional & Economic Blocks Value: % Share Iran’s Non-Oil Export Source: I.R. Iran Customs Administration * Estimate Iran’s Import EXIT
Main Trading Partners (Top 10) Value: $US Million Non-Oil Export Imports Source: I.R. Iran Customs Administration * Estimate EXIT
Non-Oil Export Trends Value: $US Billion Iran’s Non-Oil Export Source: I.R. Iran Customs Administration * Estimate EXIT
Non-Oil Export ($US Billion) Share Projects Value ($US Billion) • Source: I.R. Iran Customs Administration • * Estimate EXIT
Import Trends Value: $US Billion Iran’s Import Source: I.R. Iran Customs Administration * Estimate EXIT
Import by Main Products Source: I.R. Iran Customs Administration * Estimate EXIT
Import Structure Source: I.R. Iran’s Custom * Estimate 38
Free Zones Trade & Industrial EXIT
Advantages 6 Free Trade-Industrial Zones 19 Special Economic Zones • Unique Geographical Locations • Sufficiently Developed Infrastructure • Foreign Investment Incentives EXIT