Download
1 / 13
130 likes | 281 Views
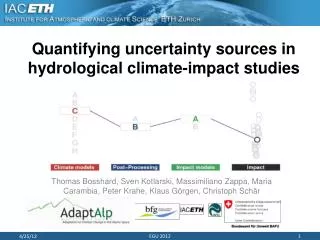
Quantifying uncertainty sources in hydrological climate-impact studies. Thomas Bosshard , Sven Kotlarski , Massimiliano Zappa, Maria Carambia , Peter Krahe , Klaus Görgen , Christoph Schär. Motivation. Climate models (CM). Statistical Post-Processing (PP). Hydrological model (HM).

E N D
Quantifying uncertainty sources in hydrological climate-impact studies Thomas Bosshard, Sven Kotlarski, Massimiliano Zappa, Maria Carambia, Peter Krahe, Klaus Görgen, ChristophSchär EGU 2012
Motivation Climate models (CM) Statistical Post-Processing (PP) Hydrological model (HM) • Knowledge about the importance of different uncertainty sources might help for the design of future impact studies • Test a method to decompose the total uncertainty EGU 2012
Study area Alpine Rhine • Area: 6119 km2 • Average height: 1800 ma.s.l. • About 20 % of the annual runoff is seasonally redistributed due to hydropower production. EGU 2012
Experimental setup 3 simulation periods CTL period 1961-1990 SCE1 period 2021-2050 SCE2 period 2070-2099 EGU 2012
ANOVA: Decomposition of variance • Ideal to study the effect of (at least) categorical variables on the variation in a numerical variable Variance contribution of: Climate models Statistical post-processing Hydrological models … ANOVA Interactions Impact variables: Changes in the annual cycle of runoff Changes in runoff quantiles EGU 2012
Climate change in the mean annual cycle • Decrease in summer • Increase in winter • Highest uncertainty in summer HBV PREVAH DC SCE-CTL [mm/d] BC SCE-CTL [mm/d] EGU 2012
Mean annual cycle of runoff • Climate models (CM) dominate in summer • Hydrological models (HM) become the most important source in winter of SCE2 • Interactions account for 10-40 % • Overall, highly varying contributions throughout the annual cycle EGU 2012
Runoff quantiles • For high quantiles, climate models and statistical the post-processing are the most important sources (particularly in SCE2) • For low quantiles, the hydrological modelscontribute up to 60 %in SCE2 • Interactions are more important in SCE1 than in SCE2 EGU 2012
Conclusions • Simulation of hydrological climate-impacts with 32 ensemble members in the Alpine Rhine • Quantification of 3 uncertainty sources: CM, PP, HMplus interactions between them • Time varying contribution and interactions confirm the need for multi-uncertainty-source impact studies • The ANOVA method proofed to be a flexible tool that could be used for various experimental setups andclimate-impactvariables More details: Bosshard et al. (Water Resour. Res., in revision) EGU 2012
Outlook • Use more PP methods and HMs • Include further uncertainty sources into the ANOVA model (e.g. emission scenario, land-use scenarios) • See also Finger et al. (2012) and Köplin et al. (in prep) (By courtesy of Köplin, N.) EGU 2012
Time for Questions ? EGU 2012
Climate change in the mean annual cycle • Increase in low quantiles • Decrease in intermediate quantiles • Unclear signal for high quantiles HBV PREVAH DC SCE-CTL [mm/d] BC SCE-CTL [mm/d] EGU 2012
Hydrological models: validation EGU 2012