Download
1 / 1
Analysis of T Cell and Melanoma Cell Expression in Cryopreserved Metastasis Ma-Mel-48b
10 likes | 102 Views
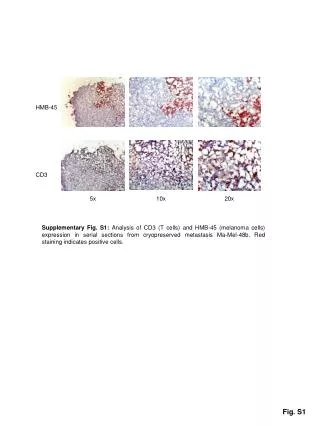
This supplementary figure showcases the examination of CD3 (T cells) and HMB-45 (melanoma cells) expression in serial sections from cryopreserved metastasis Ma-Mel-48b. The red staining indicates positive cells. The analysis offers insights into the interaction between these cells within the metastatic site.
Download Presentation 
Analysis of T Cell and Melanoma Cell Expression in Cryopreserved Metastasis Ma-Mel-48b
An Image/Link below is provided (as is) to download presentation
Download Policy: Content on the Website is provided to you AS IS for your information and personal use and may not be sold / licensed / shared on other websites without getting consent from its author.
Content is provided to you AS IS for your information and personal use only.
Download presentation by click this link.
While downloading, if for some reason you are not able to download a presentation, the publisher may have deleted the file from their server.
During download, if you can't get a presentation, the file might be deleted by the publisher.
E N D
Presentation Transcript
HMB-45 CD3 5x 10x 20x Supplementary Fig. S1: Analysis of CD3 (T cells) and HMB-45 (melanoma cells) expression in serial sections from cryopreserved metastasis Ma-Mel-48b. Red staining indicates positive cells. Fig. S1


More Related