Download
1 / 13
130 likes | 269 Views
Challenges to Forecast Evaluation. Tom Pagano : Tom.Pagano@por.usda.gov : 503 414 3010. Incomplete historical records Getting the right “observed” Changes in forecast system Getting the right balance between usefulness and understandability. Incomplete historical records:

E N D
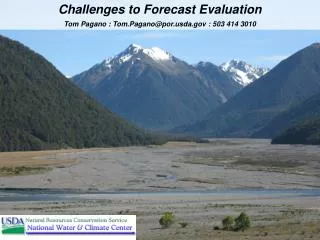
Challenges to Forecast Evaluation Tom Pagano : Tom.Pagano@por.usda.gov : 503 414 3010
Incomplete historical records Getting the right “observed” Changes in forecast system Getting the right balance between usefulness and understandability
Incomplete historical records: To get a stable set of data, you often need decades of old forecasts, which often aren’t available.
Incomplete historical records: To get a stable set of data, you often need decades of old forecasts, which often aren’t available. Lake Powell Inflow Example: 1947: April 1 forecasts start (Apr-Sep target) 1947-1963: Gage moves 4 times (or is just the name changed?) ~1960: February and March 1 forecasts start 1960: Apr-July target now available 1980: January 1 forecasts start 1980’s: NRCS-NWS coordination starts NRCS digital records missing: 1981, 1985-1989, 1996
Getting the right observed Lake Powell April 1 Apr-Jul Inflow Forecast Error Forecast too high 17 years and only 1 major underforecast? Forecast – Observed kaf Forecast too low
Getting the right observed: But this is just comparing “today’s” version of the observed. The old forecasters could’ve been shooting at a different target.
Getting the right observed: But this is just comparing “today’s” version of the observed. The old forecasters could’ve been shooting at a different target. Types of streamflow: Observed Actual Modified Unregulated/Regulated Adjusted/Unadjusted Natural “Lewis and Clark” flow Types of adjustments: Reservoir storage Diversions Consumptive use Transpiration Changing demand Land use change Evaporation from reservoirs Bank storage Surface/Groundwater interactions Do users even know the target of the current forecasts?
Changes in forecast system over time:
Changes in forecast system over time:
Changes in forecast system over time:
Changes in forecast system over time: What is still relevant to the future? Other approach: “Model” forecasts ?
Balancing usefulness and understandability In the research community, forecast evaluation is a dark art with impenetrable jargon and subtle concepts. In many ways “simple” approaches are too simple but complicated methods may not be practical
Balancing usefulness and understandability In the research community, forecast evaluation is a dark art with impenetrable jargon and subtle concepts. In many ways “simple” approaches are too simple but complicated methods may not be practical If forecast evaluation does interest you http://www.bom.gov.au/bmrc/wefor/staff/eee/verif/verif_web_page.html is a world-class introduction and resource “Perfect forecasts are all alike; Every imperfect forecast is imperfect in its own way” -Holly Hartmann (with apologies to Tolstoy)