Download
1 / 8
80 likes | 334 Views
Financial Aid for Graduate and First-Professional Students 2003-04. NASSGAP/NCHELP 22nd Annual Student Financial Aid Research Network Conference June 9-11, 2005. Susan Choy MPR Associates Berkeley, California schoy@mprinc.com. Graduate and First-Professional Students. Full-time, full-year.

E N D
Financial Aid for Graduate and First-Professional Students 2003-04 NASSGAP/NCHELP 22nd Annual StudentFinancial Aid Research Network Conference June 9-11, 2005 Susan Choy MPR AssociatesBerkeley, California schoy@mprinc.com
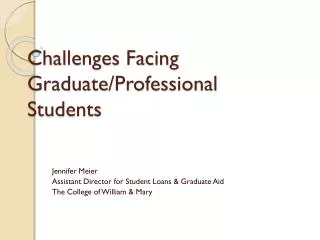
Graduate and First-Professional Students Full-time, full-year 14% Other Less than full-time, full-year 11% 3% 2% 13% 12% First-Professional 10% 60% Master’s 47% 7% 14% Doctoral 7%
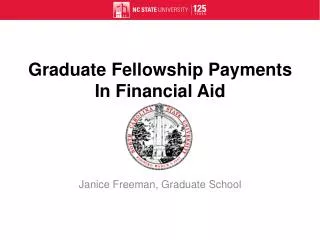
Master’s Degree Students Percent Delayed no more than 2 years Percent of total Primarily employee Worked full time Enrolled part time Male Business (MBA) Education* All other master’s degrees 1832 50 3538 52 5920 46 6466 42 7270 47 8087 72 *MEd, MAT, or other master’s degree and education major
Average Amount Received $12,6009,50012,500 4,9002,8005,100 16,20012,50013,100 7,5007,8008,400 MBA Education Other Master’s Degree Students Percent with Aid 73 63 Any aid 74 49 32 Grants 38 38 37 Loans 42 6 Assistantships 7 19 0 20 40 60 80 100 Percent
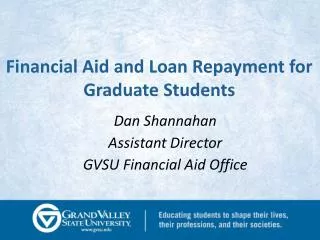
Doctoral Degree Students Percent Delayed no more than 2 years Percent of total Primarily employee Worked full time Enrolled full time Male PhD (Except in Education) Education doctorate Other doctorate 5816 27 4311 50 5536 45 1566 28 3070 33 5424 58 *EdD or other doctorate and education major.
Average Amount Received $21,20012,70021,700 12,2005,3007,000 12,80015,00022,800 14,00010,10010,100 PhD (Except in Education) Education Other Doctoral Degree Students Percent with Aid 87 69 Any aid 80 63 42 Grants 44 20 30 Loans 54 58 Assistantships 19 17 0 20 40 60 80 100 Percent
First-Professional Degree Students Percent Delayed no more than 2 years Percent of total Primarily employee Enrolled full time Male Medicine (MD) Other health Law Theology 2525 41 10 7875 62 36 4947 54 77 24 10 26 9392 79 24
Average Amount Received $33,70029,20025,600 7,2004,7008,400 32,00028,40023,000 7,300*5,200 First-Professional Degree Students Percent with Aid 92 93 Any aid 89 41 37 Grants 39 83 86 Loans 83 8 Assistantships 6 7 0 20 40 60 80 100 Percent MD Other health *Too few cases to estimate. Law