Download
1 / 13
130 likes | 331 Views
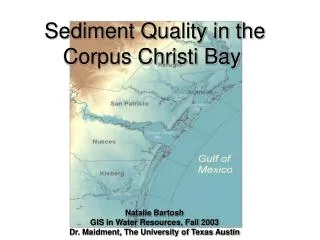
Sediment Quality in the Corpus Christi Bay. Natalie Bartosh GIS in Water Resources, Fall 2003 Dr. Maidment, The University of Texas Austin. Corpus Christi Bay is the gateway to the nation’s sixth largest port and the third largest refinery and petrochemical complex.

E N D
Sediment Quality in the Corpus Christi Bay Natalie Bartosh GIS in Water Resources, Fall 2003 Dr. Maidment, The University of Texas Austin
Corpus Christi Bay is the gateway to the nation’s sixth largest port and the third largest refinery and petrochemical complex. • Coastal Bend refineries have the combined capacity to process more than 700,000 barrels per day of crude oil, accounting for approximately 13 percent of Texas production and 5 percent of the U.S. total. • The number of oil and chemical spills has decreased since about 1990, primarily due to the enactment of the Oil Pollution Act of 1990 which imposed new requirements for vessel construction, crew licensing, and financial responsibility for damages. • Oil and petrochemicals make up more than 90 percent of the cargo tonnage moved by ship and barge on the waters of the Coastal Bend Bays. • In addition to petroleum refining, the bay is heavily used for commercial and recreational shrimping and fishing.
Importance of Good Sediment Quality • Sediment quality is important because sediments are a ‘sink’ or repository for pollutants such as metals and pesticides. • Sediments accumulate and concentrate pollutants over a long period of time. When activities such as dredging disturb contaminated sediments the result can be a reintroduction of pollutants into the water column. • Many factors contribute to water and sediment quality. In addition to discharges from municipal and industrial wastewater treatment plants (point sources), we must also consider the diffuse runoff from urban and rural areas (nonpoint sources). • The question then becomes, “How do I effectively model the quality of the sediments in the Corpus Christi Bay?” • Answer: Via the use of the Environmental Protection Agency’s (EPA) Regional Environmental Monitoring and Assessment Program (REMAP).
REMAP • REMAP is an EPA program designed to use environmental monitoring data from multiple spatial and temporal scales to assess ecological conditions and forecast potential risk to our natural resources. • The Texas Coastal Region REMAP Project consisted of 109 random testing locations over the length of the Texas Coast. • The Corpus Christi Bay included 52 locations in which data was taken from 1993-1994. • The recorded data included top and bottom water quality, sediment grain composition and chemistry, and fish species.
Sediment Chemistry • 826 chemical species were measured at each location • The task then became a need to narrow down the list to a few select species that would tell the most about the quality of the sediment. • The following metals were chosen for analysis: Arsenic, Chromium, Copper, Lead, Mercury and Zinc.
Comparison of the Metals Lead Zinc
Comparison of the Metals, Cont’d. Copper Chromium
Comparison of the Metals, Cont’d. Mercury Arsenic
Analysis of Sediment Data • Effects Range – Low (ER-L): Concentration of a chemical in sediment below which toxic effects are rarely observed among sensitive species. • As the table indicates, the only metals to be concerned about (at least for now) are Mercury and Zinc.
Frequency of Detection • The frequency at which a given chemical or chemical group is responsible for sites in the NSI being categorized as Tier 1 or Tier 2 is often a reflection of the number of times that chemical is measured and detected in sediment samples. • Thus, chemicals that are measured and detected less frequently might not often be identified as posing a potential risk to aquatic life or human health, even though the chemical is highly toxic.
Future Work • Reading through an analysis of the Corpus Christi Bay entitled: Current Status and Historical Trends of Ambient Water, Sediment, Fish and Shellfish Tissue Quality in the Corpus Christi Bay National Estuary Program Study Area (summary report). Ward, G.H. and N.E. Armstrong. 1997. • This paper will hopefully give me insight as to the numbers I have seen in my comparisons of the metals and help me to make an educated assessment of the bay. • My next step is to use the GIS kriging tools to better evaluate the concentrations of the metals in the bay.
References and Thanks • Ken Dunton of the UT Marine Science Institute in Port Aransas, Tx • The Coastal Bend Bays Plan, August 1998. http://www.sci.tamucc.edu/ccbnep/Home/Plan/cbbin.pdf • EPA REMAP http://www.epa.gov/nerleerd/emapremap.htm • EPA National Sediment Quality Survey http://www.epa.gov/waterscience/cs/vol1/appdx_d.pdf • Dr. Maidment