Maintenance and Reliability
Maintenance and Reliability. 17. PowerPoint presentation to accompany Heizer and Render Operations Management, 10e Principles of Operations Management, 8e PowerPoint slides by Jeff Heyl Additional content from Gerry Cook. Outline.


Maintenance and Reliability
E N D
Presentation Transcript
Maintenance and Reliability 17 PowerPoint presentation to accompany Heizer and Render Operations Management, 10e Principles of Operations Management, 8e PowerPoint slides by Jeff Heyl Additional content from Gerry Cook
Outline • The Strategic Importance of Maintenance and Reliability • Reliability • Improving Individual Components • Providing Redundancy • Maintenance • Implementing Preventive Maintenance • Total Productive Maintenance • Techniques for Enhancing Maintenance
Learning Objectives Describe how to improve system reliability Determine system reliability Determine mean time between failure (MTBF) Distinguish between preventive and breakdown maintenance Describe how to improve maintenance Compare preventive and breakdown maintenance costs
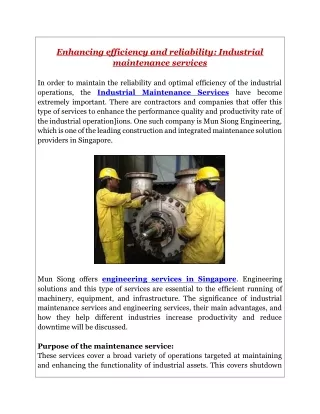
Orlando Utilities Commission • Maintenance of power generating plants • Every year each plant is taken off-line for 1-3 weeks maintenance • Every three years each plant is taken off-line for 6-8 weeks for complete overhaul and turbine inspection • Each overhaul has 1,800 tasks and requires 72,000 labor hours • OUC performs over 12,000 maintenance tasks each year • Every day a plant is down costs OUC $110,000 • Unexpected outages cost between $350,000 and $600,000 per day
Strategic Importance of Maintenance and Reliability • Failure has far reaching effects on a firm’s • Operation • Reputation • Profitability • Dissatisfied customers • Idle employees • Profits becoming losses • Reduced value of investment in plant and equipment
Maintenance and Reliability • Reliability is the probability that a machine will function properly for a specified time • Tactics to improve Reliability • Improving individual components • Providing redundancy • Maintenance: activities involved in keeping a system’s equipment in working order • Maintenance Tactics • Implementing or improving preventive maintenance • Increasing repair capability or speed
Reliability Improving individual components Rs= R1x R2x R3x … x Rn where R1 = reliability of component 1 R2 = reliability of component 2 and so on
100 – 80 – 60 – 40 – 20 – 0 – n = 1 n = 10 Reliability of the system (percent) n = 50 n = 100 n = 200 n = 400 n = 300 | | | | | | | | | 100 99 98 97 96 Average reliability of each component (percent) Overall System Reliability Figure 17.2
R1 R2 R3 Rs .90 .80 .99 Reliability Example Reliability of the process is Rs= R1 x R2x R3 = .90 x .80 x .99 = .713 or 71.3%
Number of failures Number of units tested FR(%) = x 100% FR(N) = Mean time between failures Number of failures Number of unit-hours of operating time 1 FR(N) MTBF = Product Failure Rate (FR) Basic unit of measure for reliability
FR(%) = (100%) = 10% 2 20 FR(N) = = .000106 failure/unit hr 2 20,000 - 1,200 1 .000106 MTBF = = 9,434 hrs Failure Rate Example 20 air conditioning units designed for use in NASA space shuttles operated for 1,000 hours One failed after 200 hours and one after 600 hours
FR(%) = (100%) = 10% 2 20 FR(N) = = .000106 failure/unit hr 2 20,000 - 1,200 1 .000106 MTBF = = 9,434 hrs Failure Rate Example 20 air conditioning units designed for use in NASA space shuttles operated for 1,000 hours One failed after 200 hours and one after 600 hours
Probability of first component working Probability of second component working Probability of needing second component + x (.8) + (.8) x (1 - .8) = .8 + .16 = .96 Providing Redundancy Provide backup components to increase reliability
R1 R2 R3 0.90 0.80 0.90 0.80 0.99 Redundancy Example A redundant process is installed to support the earlier example where Rs = .713 Reliability has increased from .713 to .94 = [.9 + .9(1 - .9)] x [.8 + .8(1 - .8)] x .99 = [.9 + (.9)(.1)] x [.8 + (.8)(.2)] x .99 = .99 x .96 x .99 = .94
Maintenance • Two types of maintenance • Preventive maintenance – routine inspection and servicing to keep facilities in good repair • Breakdown maintenance – emergency or priority repairs on failed equipment
Maintenance Costs • The traditional view attempted to balance preventive and breakdown maintenance costs • Typically this approach failed to consider the true total cost of breakdowns • Inventory • Employee morale • Schedule unreliability
Total costs Total costs Full cost of breakdowns Preventive maintenance costs Costs Costs Breakdown maintenance costs Preventive maintenance costs Maintenance commitment Maintenance commitment Optimal point (lowest cost maintenance policy) Optimal point (lowest cost maintenance policy) Maintenance Costs Traditional View Full Cost View
Maintenance Cost Example Should the firm contract for maintenance on their printers? Average cost of breakdown = $300
∑ Expected number of breakdowns Number of breakdowns Corresponding frequency = x Maintenance Cost Example Compute the expected number of breakdowns = (0)(.1) + (1)(.4) + (2)(.3) + (3)(.2) = 1.6 breakdowns per month
= x Expected breakdown cost Cost per breakdown Expected number of breakdowns Maintenance Cost Example Compute the expected breakdown cost per month with no preventive maintenance = (1.6)($300) = $480 per month
Preventive maintenance cost Cost of expected breakdowns if service contract signed = + Cost of service contract Maintenance Cost Example Compute the cost of preventive maintenance = (1 breakdown/month)($300) + $150/month = $450 per month Hire the service firm; it is less expensive
Total Productive Maintenance (TPM) • Designing machines that are reliable, easy to operate, and easy to maintain • Emphasizing total cost of ownership when purchasing machines, so that service and maintenance are included in the cost • Developing preventive maintenance plans that utilize the best practices of operators, maintenance departments, and depot service • Training for autonomous maintenance so operators maintain their own machines and partner with maintenance personnel
Problems With Breakdown Maintenance • “Run it till it breaks” • Might be ok for low criticality equipment or redundant systems • Could be disastrous for mission-critical plant machinery or equipment • Not permissible for systems that could imperil life or limb (like aircraft)
Problems With Preventive Maintenance • “Fix it whether or not it is broken” • Scheduled replacement or adjustment of parts/equipment with a well-established service life • Typical example – plant relamping • Sometimes misapplied • Replacing old but still good bearings • Over-tightening electrical lugs in switchgear
Another Maintenance Strategy • Predictive maintenance – Using advanced technology to monitor equipment and predict failures • Using technology to detect and predict imminent equipment failure • Visual inspection and/or scheduled measurements of vibration, temperature, oil and water quality • Measurements are compared to a “healthy” baseline • Equipment that is trending towards failure can be scheduled for repair
In-Class Problems from the Lecture Guide Practice Problems Problem 1: California Instruments, Inc., produces 3,000 computer chips per day. Three hundred are tested for a period of 500 operating hours each. During the test, six failed: two after 50 hours, two at 100 hours, one at 300 hours, and one at 400 hours. Find FR(%) and FR(N).
In-Class Problems from the Lecture Guide Practice Problems Problem 2: If 300 of these chips are used in building a mainframe computer, how many failures of the computer can be expected per month?
In-Class Problems from the Lecture Guide Practice Problems Problem 3: Find the reliability of this system:
In-Class Problems from the Lecture Guide Practice Problems • Problem 4: • Given the probabilities below, calculate the expected breakdown cost. • Assume a cost of $10 per breakdown.