Download
1 / 32
400 likes | 661 Views
AMS Weather Studies Introduction to Atmospheric Science, 5 th Edition. Chapter 2 Atmosphere: Origin, Composition, & Structure. Driving Question. What is the composition and structure of the atmosphere? This chapter covers: Evolution of the atmosphere Investigation of the atmosphere

E N D
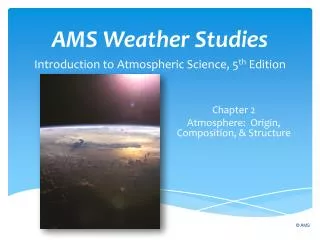
AMS Weather StudiesIntroduction to Atmospheric Science, 5th Edition Chapter 2 Atmosphere: Origin, Composition, & Structure
Driving Question • What is the composition and structure of the atmosphere? • This chapter covers: • Evolution of the atmosphere • Investigation of the atmosphere • How meteorologists monitor the atmosphere • Surface and upper-air observations and remote sensing • The temperature profile of the atmosphere • Electromagnetic characteristics of the upper atmosphere
Case-in-PointAfrican Origins of Wind-Borne Dust in the Americas • Weather and climatic issues in one part of the world can affect those in another part. • North African dust storms can affect the weather and air quality of the southeastern U.S. • Dust can harbor microscopic disease-causing organisms. • This dust may be harming coral reefs in the Caribbean. • This dust may increase the frequency of red tides.
Evolution of the Atmosphere • Earth System • Made up of atmosphere, hydrosphere, geopshere, biosphere • Atmosphere • Composed of gases and suspended particles • Half of mass found within 5500 m (18,000 ft) of Earth’s surface. • 99% of the mass is below 32 km (20 mi)
Evolution of the Atmosphere • Primeval Phase • Earth evolved from a nebula • Gases surrounding Earth were primarily helium and hydrogen • Also hydrogen compounds, including methane and ammonia • Eventually, these escaped to space • 4.4 billion years ago, enough gravity to retain an atmosphere • Outgassing – principal source of Earth’s atmosphere • Rocks outgassed as they solidified and cooled • Primarily carbon dioxide, nitrogen and water vapor • Trace amounts of methane, ammonia, sulfur dioxide, hydrogen sulfide and hydrochloric acid • Water vapor broken into hydrogen and oxygen by UV radiation The Eagle Nebula Outgassing
Evolution of the Atmosphere • Primeval Phase • 4.5-2.5 billion years ago, sun 30% fainter • CO2 combined with rainwater to form carbonic acid • Reacted with rock, locking carbon into solid, so less in atmosphere • Living organisms took CO2 out of the atmosphere via photosynthesis, locking carbon into carbohydrates • Oxygen the 2nd most abundant gas in atmosphere • Nitrogen is the 1st • Inert, out-gassing product • Nitrogen removed from atmosphere by biological and atmospheric fixation • CO2 minor component of atmosphere for the last 3.5 billion years • Fluctuations play important roles in climate change
Evolution of the Atmosphere • Modern Phase • Lower atmosphere (80 km or 50 mi) circulates, maintains uniform ratios of gasses (homosphere) • Above this, gases separate based on weight • Results in stratified layers • Heterosphere • Nitrogen ~78.08%, Oxygen ~20.95% of the homosphere • Argon < 1% • CO2 < 0.04% • Oxygen • O2 in the homosphere • O in the heterosphere • 150 km (95 miles) above Earth’s surface • UV radiation splits O2
Evolution of the Atmosphere Note: Water vapor varies greatly by location and so is not included.
Evolution of the Atmosphere • Modern Phase • Earth’s atmosphere also has aerosols • Liquid and solid particles • Sources: wind erosion of soil, ocean spray, forest fires, volcanic eruptions, agricultural & industrial activities • Water vapor • By volume: < 4% of the lowest 1 km of the atmosphere • Necessary for clouds and precipitation • CO2 required for essential function to all life (photosynthesis) • Both CO2 and water vapor absorb and emit infrared radiation • Keeps the lower atmosphere warm • Allows for life to exist
Evolution of the Atmosphere • Air pollution • Gas or aerosol that occurs at a concentration threatening the well-being of living organisms • Most are human-made, some are natural • Dust storms, volcanoes, pollen, decay of plants/animals • Primary air pollutants • Harmful immediately as emitted • Secondary air pollutants • Harmful after combination with one or more substances • Photochemical smog Coal-fired electric power plant in Green Bay, WI. Smog near Los Angeles, CA.
Evolution of the Atmosphere • The Environmental Protection Agency (EPA) • Standards for 6 air pollutants: • carbon monoxide ■ lead ■ ozone • nitrogen oxides ■ particulates ■ sulfur dioxide • Primary air quality standards • Maximum exposure levels humans can tolerate without ill effects • Secondary air quality standards • Maximum exposure levels allowable to minimize the impact on crops, visibility, personal comfort, and climate • Compliance with standards • Attainment areas – geographic regions where standards are met or below • Non-attainment areas – geographic regions where the primary standard is not met
Investigating the Atmosphere • Scientific method • Identify questions related to the problem • Propose an answer • This is an educated guess • State the educated guess in a manner that can be tested • This is the hypothesis • Predict the outcome as if the hypothesis were correct • Test the hypothesis to see if the prediction is correct • Reject or revise the hypothesis if the prediction is wrong • Scientific theory – hypothesis accepted by the scientific community
Investigating the Atmosphere • Scientific models • Approximations or simulations of real system • Scientific models of the Earth-atmosphere system • Conceptual model • Statement of a fundamental law or relationship • Example: the geostrophic wind model • Graphical model • Compiles and displays data in a format that readily conveys meaning • Example: a weather map • Physical model • Miniaturized version of a system • Example: a tornado vortex chamber
Investigating the Atmosphere Purdue University's Tornado Vortex Chamber (A), which simulates tornadoes (B). This is a physical model.
Investigating the Atmosphere • Scientific models of the Earth-atmosphere system • Numerical Models • Used by meteorologists • Mathematical equations represent relationships among system variables • Example: a global climate model and rising CO2 • All other climate variables are held constant • CO2 is increased • Results are noted • All models have inherent errors • Missing/erroneous observational data • Accuracy of component equations may be a problem
Monitoring the AtmosphereHistorical Perspective • Surface Observations • Systematic observations as 1644-45 (in North America) • Old Swedes Fort (Wilmington, DE) had 1st systematic observations • Long-term instrument-based temperature records • 1732: Philadelphia, 1738; Charleston, SC; 1753: Cambridge, MA; 1781: New Haven, CT (uninterrupted to today) • 1814: Army monitored weather to understand troop health • Mid-1800s: national network of volunteer observers • 1849: telegraph companies transmitted weather conditions free of charge • 1860s: loss of ships in Great Lakes • Government took a greater role in forecasting. • 1870: President Grant established 24 stations under the U.S. Army Signal Corps
Monitoring the Atmosphere • Surface Observations • 1891: nation’s weather network transferred from military to civilian • New weather bureau under U.S. Department of Agriculture • 1940: Transferred to Commerce Department • 1965: Weather Bureau reorganized into National Weather Service (NWS) • Under Environmental Science Services Administration (ESSA), which became National Oceanic and Atmospheric Administration (NOAA) • 1990s: NWS modernized and expanded • Today, 123 NWS Forecast Offices. • Added Automated Surface Observing Systems (ASOS)
Monitoring the Atmosphere • Automated Surface Observing System (ASOS) • Consists of electronic sensors, computers, fully automated communications ports • Feeds data to NWS Forecast Offices 24 hours a day
Monitoring the Atmosphere • NWS Cooperative Observer Network • Member stations record daily precipitation, maximum and minimum temperatures • Used for hydrologic, agricultural, climatic purposes 20
Monitoring the WeatherHistorical Perspective • Upper air observation • Kites • 1749: Glasgow, Scotland, Alexander Wilson • Balloons • Manned balloon, 1804, Gay-Lussac & Biot • Air samples taken, measured temperature, humidity • Up to 7,000 m (23,000 ft) • Manned balloon, 1862, Glaisher & Coxwell • Weather measurements to 7600 m (25,000 ft) • Nearly perished from cold and oxygen deprivation • Kites • 1894: carried the first thermograph aloft • 1907-1933: box kites with meteorographs • Up to 3000 m (10,000 ft)
Monitoring the WeatherHistorical Perspective • Upper air observations • First radiosonde in the late 1920s. • Small instrument package equipped with a radio transmitter • Carried aloft by a helium or hydrogen filled balloon • Allowed for monitoring at higher altitudes • Transmits altitude readings of temperature, air pressure, and dewpoint • First official U.S. Weather Bureau radiosonde launched at East Boston, MA in 1937. • A radiosonde tracked from the ground to measure variations in wind direction/speed with altitude is a rawinsonde
Monitoring the Atmosphere Temperature Sensor GPS Pressure Sensor Launching a radiosonde Radiosonde
Monitoring the Atmosphere Data from radiosonde shown in a Stüve diagram
Monitoring the Atmosphere • Remote Sensing • Measurement of environmental conditions by processing signals either emitted by an object or reflected back to a signal source • Radar • Satellites
Temperature Profile of the Atmosphere • Troposphere • Lowest layer • Weather occurs within • Temperature decreases with altitude • Exceptions: inversion, isothermal layer • Average temperature drop is 6.5 °C/1000 m (3.5 °F/1000 ft) • ~6 km (3.7 mi) thick at the poles • ~20 km (12 mi) thick at the equator • Tropopause • Transition zone to next layer It is generally colder on mountain peaks than in lowlands.
Temperature Profile of the Atmosphere • Stratosphere • From troposphere to ~50 km (30 mi) • In isothermal condition in lower stratosphere • Constant temperature constant • Above 20 km (12 mi), temperature increases with altitude • Stable conditions ideal for jet aircraft travel • Trap pollutants (e.g. from volcanic eruptions) in lower stratosphere • Stratopause – transition zone to next layer • Mesosphere • From stratopause up to about 80 km (50 mi) • Temperature decreases with increasing altitude • Mesosphere – transition zone to next layer • Thermosphere • Temperatures isothermal initially then rise rapidly • Sensitive to incoming solar radiation • More variable than in other regions
The Ionosphere and the Aurora • Ionosphere • Located mostly in thermosphere. • High concentration of ions and electrons • Electrically-charged, atomic-scale particles • Caused by solar energy stripping electrons from oxygen and nitrogen molecules • Leaves a positive charge • Auroras are found in ionosphere. • Caused by solar wind • Sub-atomic, super-hot, electrically charged particles • Earth’s magnetic field deflects the solar wind • Makes a teardrop-shaped cavity known as the magnetosphere • Auroras are only visible at higher latitudes
The Ionosphere and the Aurora Average variation of particle density with altitude in the ionosphere
The Ionosphere and the Aurora • Magnetosphere • Caused by the deflection of the solar wind by Earth’s magnetic field Aurora borealis
The Ionosphere and the Aurora The Northern Hemisphere auroral oval, an area of continuous auroral activity.