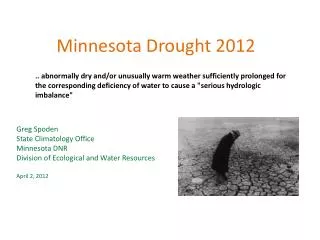
The 2012 Drought
This paper examines the severity of the 2012 drought in comparison to the historical Dust Bowl of the 1930s. Key discussion questions explore whether the 2012 drought is as severe, how it can be compared, and various methods of measuring drought severity. Utilizing bar graphs to illustrate drought conditions, the analysis focuses on the drought's extent across different regions and time periods, providing insights into similarities and differences with the Dust Bowl's impact on agriculture, ecology, and society.

The 2012 Drought
E N D
Presentation Transcript
The 2012 Drought How Bad Is It?
Title your paper “2012 Drought Compared to the Dust Bowl.” • Copy each discussion question as it appears on the slide. • Then write your answer below.
Recall the video and handout about the Dust Bowl. Based on those... 1. Do you think the 2012 drought is as bad as the Dust Bowl? Explain why or why not.
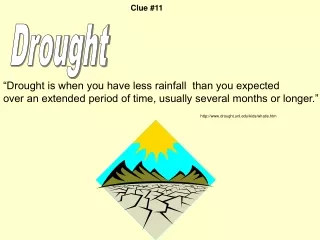
3. How many different ways can you think of to measure drought severity? List them here.
Write these questions down, then use the image on the next slide to answer. 4. How is drought being measured in this bar graph? 5. Which Dust Bowl years are included in this bar graph? 6. How does the 2012 drought compare to the Dust Bowl according to this bar graph?
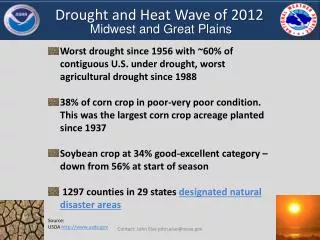
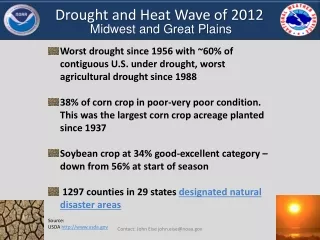
The previous slide showed a bar graph reflecting conditions as of July 2012. In August 2012, 63% of the area (lower 48 states) was experiencing drought conditions. 7. How does the 2012 drought compare to the Dust Bowl using the August data?
Write these questions down, then use the image on the next slide to answer. 8. How is drought being measured in this (second) bar graph? 9. Using this measure, how does the 2012 drought compare to Dust Bowl years?
10. In what ways is the 2012 drought similar to the Dust Bowl? 11. In what ways is the 2012 drought different than the Dust Bowl?