Download
1 / 29
290 likes | 378 Views
Explore outflowing galactic winds at redshift z=1, their properties, prevalence, and impact on galaxy evolution. Investigate blueshifted outflows, absorption lines, star formation regulation, and AGN feedback. Utilizing spectroscopic data from LRIS and DEIMOS, study outflow diagnostics like MgII and FeII*.

E N D
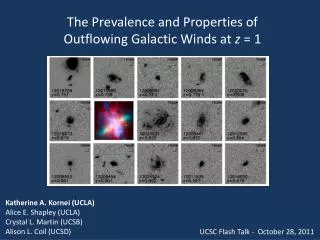
The Prevalence and Properties of Outflowing Galactic Winds at z = 1 Katherine A. Kornei (UCLA) Alice E. Shapley (UCLA) Crystal L. Martin (UCSB) Alison L. Coil (UCSD) UCSC Flash Talk - October 28, 2011
Galaxies are not closed boxes. outflows? outflows? IGM cold streams? AGN feedback? Outflows AGN feedback? enrich the IGM in metals/dust …quench star formation …regulate black hole growth
Outflows are seen in local starbursts. M82 (z=0.0008) HST/ACS BVIHα (M. Westmoquette)
Outflows can be inferred through line offsets. Given outflowing material between the observer and the galaxy: MgII 2796/2803 [OII] 3727 Å Nebular line – at zsys zsys MgI 2852 MgI MgII DN/sec/pixel Weiner et al. 2009 Outflowing gas will be blueshifted with respect to nebular lines tracing star forming regions. Velocity (km/sec)
A variety of absorption lines are used to probe outflows. Reddy et al. 2008 z 0.5 1.0 3.0 Na I D ≈ 5900 Å Fe II/Mg II ≈ 2600 Å H I + others ≈ 1200 Å Weiner et al. 2009, Rubin et al. 2010 Interstellar Lyα Steidel et al. 2010
DEEP2 survey (the origin of the sample). Slitmasks with 120 targets 50,000 galaxies at z ≈ 1 in 3.5 deg2 DEIMOS on Keck II (90 nights: ‘02-’05) R = 5000 (70 km s-1) B-R Resolved [OII] doublets z < 0.75 z > 0.75 DEEP2 Team R-I BRI color cuts in 3/4 fields for z > 0.75 Galaxy environments, ages, colors at z ≈ 1 Clustering statistics Evolution of dark matter halos Close pairs/merger rates ≈ 1 hour integration
Extended Groth Strip – no color cuts and lots of ancillary data. GALEX imaging (FUV, NUV) F606W http://aegis.ucolick.org/ HST imaging (F606W, F814W) 6” Spitzer imaging (IRAC, MIPS)
LRIS observations of DEEP2 objects at z = 1. [OII] (zsys) CIV, FeII, MgII, MgI (zout) LRIS: 7200-9000 Å LRIS: 3400-6700 Å DEIMOS: 6500-9100 Å 212 objects from the DEEP2 survey; B < 24.5 1.19 < z < 1.35 CIV 1549, MgI 2852 12012777 z = 1.27 Normalized Flux Mg I Al II Fe II Fe II Si II, C IV Mg II Rest Wavelength (angstroms)
Many analyses are possible. LRIS spectroscopy measure fine structure FeII* emission lines definezsys([OII], Balmer series) fit FeII absorption lines characterize MgII emission
72 LRIS objects are in the Extended GrothStrip. • star-formation rates • dust attenuations • HST imaging EGS (72) Other fields (140)
More analyses are possible. LRIS spectroscopy measure fine structure FeII* emission lines definezsys([OII], Balmer series) fit FeII absorption lines characterize MgII emission HST imaging, F606W & F814W morphologies colors galaxy areas inclinations SFRs, dust attenuation from GALEX
Blue, star-forming galaxies at z = 1. Kornei et al., in prep. Kornei et al., in prep.
A physical model for fitting absorption lines. Define a systemic reference frame, ideally from the LRIS spectra. Fit multiple emission lines ([OII], OIII, Balmer) using template spectra. Simultaneous fit to 5 resonant FeII absorption lines We use a single component fitwith 4 free parameters: covering fraction tilted OII lines (small fraction of sample) zsys zout op. depth at line center line center Doppler parameter (2½σ)
BlueshiftedFeII absorption features are not ubiquitous in the sample. 12100420 z = 1.20 Inflow? Martin et al., in prep. Kornei et al., in prep. Outflows Inflows Other outflow diagnostics: MgII, FeII*
The strength of outflows is correlated with various galaxy properties. Na D ULIRGs face-on outflow velocity (km/s) dwarf starbursts edge-on Chen et al. 2010 Martin 2005 SFR (M*/yr) Outflows not seen in edge-on systems. Outflow velocity increases with increasing star formation rate. face-on edge-on
No trend between outflow velocity and star-formation rate. 1000 Msun yr-1 0.1 Msun yr-1 Martin 2005
Are outflows correlated with star-formation rate surface densities? 6” F606W Σ SFR estimate Clumpy objects at high z – need a better area estimate that traces luminous regions. area estimate UV, 24 μm, emission lines, etc. Half-light radius? Petrosian radius? A = πR2
A new technique for estimating galaxy areas. Petrosian area Clump area F606W Include only those pixels brighter than a certain luminosity threshold, thereby flagging clumps. Given “clumpy” galaxies:
Higher star-formation rate surface density objects show larger blueshifts. No trend seen: Rubin et al. 2010 (used half-light radius) Steidel et al. 2010 (ground-based imaging) Kornei et al., in prep.
Composite spectra show same trends as individual objects. Star-formation rate surface density composites:: High Low High: dV = -31 ± 7 km s-1 Low: dV = 44 ± 15 km s-1 High: dV = -300 km s-1 Kornei et al., in prep. Mg II shows more kinematic variation than Fe II
The geometry of outflowingwinds at z = 1. Na D face-on edge-on Chen et al. 2010 Estimate inclination from axis ratios from HST imaging: a face-on edge-on i = cos-1(b/a) b
Face-on galaxies show stronger blueshifts than edge-on systems. Inclination composites:: Low High More edge-on: dV = 28 ± 11 km s-1 More face-on: dV = -19 ± 9 km s-1 face-on edge-on
Mergers are not required to drive outflows. Law et al. 2007 high G low G Gini (G) – measure of how light is distributed in a galaxy Lotz et al. 2008 Kornei et al., in prep. low M20 high M20 M20 – second order moment of a galaxy’s 20% brightest pixels
Fine structure FeII* emission is associated with resonance absorption lines. Does this emission come from star forming regions or from outflows? zsys v = 0 F606W Leitherer et al. 2010 probing very different scales at z = 1 and z = 0 v = +100 v = -100 8400 pc/” 16 pc/” Kornei et al., in prep. 2626 Å (fine structure) 2600 Å (resonance)
FeII* emission is prevalent. FeII* emitters FeII* non-emitters Stacks of FeII* emitters/non-emitters FeII, FeII* MgII FeII* emission appears to be ubiquitous Kornei et al., in prep. The strongest FeII* emitters are bright and blue. stronger FeII* = stronger MgII emission Kornei et al., in prep.
Complexities of the MgII feature at ≈ 2800 Å. Composite spectrum MgII and FeII absorption are kinematically distinct. Individual spectra show MgII emission MgII Martin et al., in prep. AGN? (Weiner et al. 2009) Scattered wind? (Rubin et al. 2010)
Summary. Reddy et al. 2008 [OII] (zsys) CIV, FeII, MgII, MgI (zout) LRIS: 7200-9000 Å LRIS: 3400-6700 Å DEIMOS: 6500-9100 Å Petrosian area Clump area Outflow velocity most strongly correlated with the concentration of star formation. Kornei et al., in prep.
N E Hubble Space Telescope 1.6 μm Weiner et al. 2009 F160W F775W