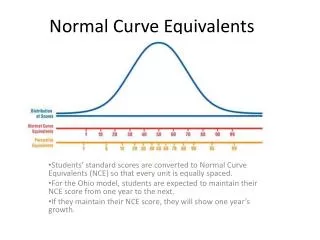
The Normal Curve
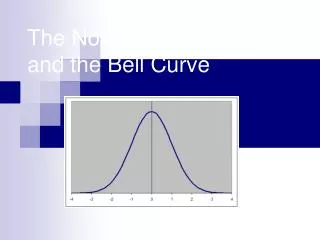
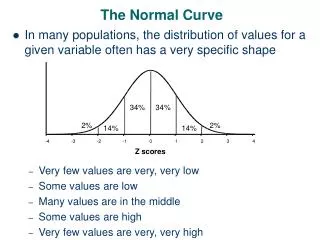
The Normal Curve. In many populations, the distribution of values for a given variable often has a very specific shape Very few values are very, very low Some values are low Many values are in the middle Some values are high Very few values are very, very high. The Normal Curve.

The Normal Curve
E N D
Presentation Transcript
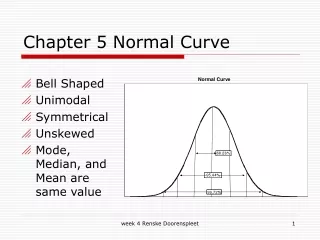
The Normal Curve • In many populations, the distribution of values for a given variable often has a very specific shape • Very few values are very, very low • Some values are low • Many values are in the middle • Some values are high • Very few values are very, very high
The Normal Curve • In many populations, the distribution of values for a given variable often has a very specific shape • This shape is called the normal curve • One reason why the normal curve is so common • Positive and negative influences, when averaged together, will often (but no always) cancel each other out
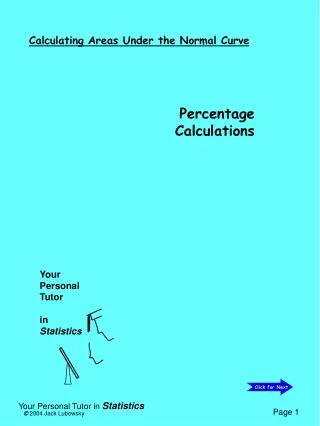
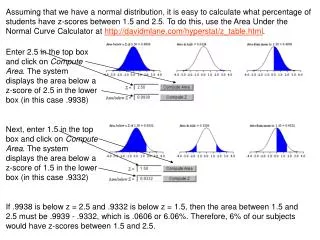
Percentages and The Normal Curve • The shape of the normal curve allows us to calculate exact percentages above or below a given raw value • Check the Area Under the Normal Curve Link at learnpsychology.com (http://members.shaw.ca/ron.blond/TLE/norm.APPLET/) • If your verbal SAT score was 600, what was your percentile? • SAT scores used to be normalized to a mean of 500 and a standard deviation of 100
From Raw Scores to Percentages: Method 1 • Rough Estimate • Step 1: Convert raw score to Z score • Step 2: Use the 34-14-2 rule to make an estimate
From Raw Scores to Percentages: Method 2 • Method 2: Look up the % in a Z table • Step 1: Raw score to Z score • Step 2: Draw Z normal curve and shade desired area • Step 3: If negative Z, remove negative sign • Step 4: Use Z table to convert Z score to “% away from the 50% mark” • Step 5: Convert “% from 50” to “% above or below”
Z Table (table is cutoff... full table is in the book)
From Percentages to Raw Scores • Follow the steps in reverse! • Could use method 1, but be sure to learn method 2 • If you were in the 40th percentile on the verbal SAT, what was your score?
The Shrinking Normal Curve: Why are there no longer any baseball players who hit over 400?Play Batting 400 movie
Introduction to Probability Outcome: heads or tails, 6, 5, 4, 3, 2, 1 Relative Frequency: The number of times something happens relative to the number of times it could have happened. Expected Relative Frequency: The expected distribution of outcomes if the experiment is run numerous times Probability: The expected relative frequency of a particular outcome
Introduction to Probability Calculating probability: Probability= Possible successful outcomes/All possible outcomes Coin Toss: Heads/(Heads or Tails)=1/2=.50=50% Dice: 1/(1 or 2 or 3 or 4 or 5 or 6)=1/6=.17=17% Probability: The expected relative frequency of a particular outcome
Introduction to Probability Calculating probability: Probability= Possible successful outcomes/All possible outcomes What is the probability of getting a 1, 2 or 3 on the dice roll? There are 3 possible outcomes The are 6 total possible outcomes P = 3/6 = .5 = 50% Calculating Probability: Some more complex examples
Introduction to Probability Calculating probability: Probability= Possible successful outcomes/All possible outcomes What is the probability of selecting a Senior from a class of 200 that contains 30 seniors? There are 30 possible outcomes The are 200 total possible outcomes P = 30/200 = .15 = 15% Calculating Probability: Some more complex examples
Introduction to Probability A probability is a proportion. It ranges between 0 and 1. Probabilities are often expressed as percentages (0 to 100) Probabilities are often expressed as ranges using < and > Example p<.05 Probability Basics
Probability and the Normal Curve: Symmetry What is the probability of selecting a person with an IQ greater than the mean compared to the probability of selecting someone with an IQ less than the mean?
Probability and the Normal Curve: Asymmetry What is the probability of selecting a person with a salary greater than the mean compared to the probability of selecting someone with a salary less than the mean?
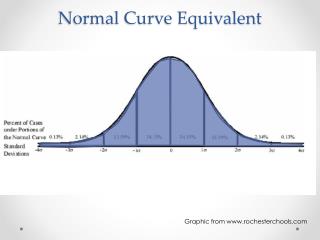
Probability and the Normal Curve The proportion of scores between any two Z scores is the same as the probability of selecting a score between the two Z scores. Example: the probability of a score being between the mean and +1 is .34 or 34%
Probability and the Normal Curve (2) An interesting case of a symmetric probability distribution. Play Binomial Balls movie
Probability, the Normal Curve & Earthquakes (5) Play the Probability of Earthquakes movie
Samples and Populations The population of Jelly Beans is vast. The jelly beans in a particular bag of Jelly Beans is a sample. What are the odds of getting a bag containing only red Beans?
Samples and Populations: We use samples to make inferences about entire populations. What are some of the major areas in which samples are used? (6) Play Basic Sampling movie
Samples and Populations Methods of Sampling Random Selection: Every member of the population has an equal probability of entering the sample. Stratified Random Selection: The population is divided into domains, or strata and random samples are taken from within the strata All other methods are biased to some degree Examples: Using a computer random number generator to pick names from the US population census Lotteries use random selection to pick a sample of winners. Bingo!
Samples and Populations: Stratified Sampling (3) Play Stratified Sampling movie.
Sample versus Population • The descriptive statistics that we have learned so far are called sample statistics in the context of inferential stats