Download
1 / 15
150 likes | 492 Views
Top-down constraints on emissions of biogenic trace gases from North America: Mapping isoprene emissions from space. Dylan Millet with D.J. Jacob and K.F. Boersma Atmospheric Chemistry Modeling Group, Harvard University T.P. Kurosu and K. Chance Harvard-Smithsonian Center for Astrophysics

E N D
Top-down constraints on emissions of biogenic trace gases from North America: Mapping isoprene emissions from space Dylan Millet with D.J. Jacob and K.F. Boersma Atmospheric Chemistry Modeling Group, Harvard University T.P. Kurosu and K. Chance Harvard-Smithsonian Center for Astrophysics C. Heald (UC Berkeley), A. Guenther (NCAR), A. Fried (NCAR), B. Heikes (URI), D. Blake (UCI), and H. Singh (NASA-Ames) IGAC-WMO-CACGP Symposium Cape Town, South Africa September 17-22, 2006
Biogenic Emissions Affect Atmospheric Composition and Climate HCHO O3 SOA … OH, h, O3 Air Quality VOC NOx, VOC, SO2 Tropospheric chemistry Climate Isoprene Most important biogenic NMVOC ~ 6x anthropogenic VOC emissions
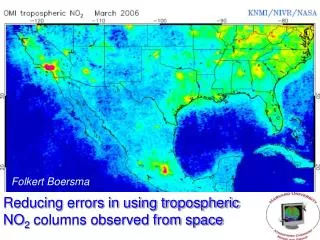
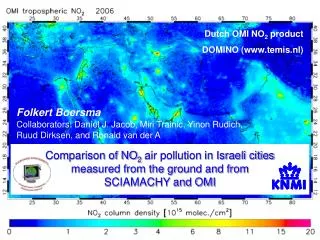
Mapping Isoprene Emissions from Space OH, h ki, Yi OH, h kHCHO HCHO VOCs ΩHCHO Isoprene a-pinene detection limit propane 100 km Distance downwind VOC source HCHO vertical columns measured by OMI (K. Chance, T.P. Kurosu et al.) Local ΩHCHO-Ei Relationship Palmer et al., JGR (2003,2006).
Testing the Approach:Errors in satellite HCHO measurements Main Sources of Error Use INTEX-A aircraft data & GEOS-Chem model to test errors in HCHO measured from space HCHO GOME/OMI sensitivity ΩHCHO = SEisoprene+ B Fitting uncertainty ~ 4 x 10¹⁵ molecules cm-2 Ratio between HCHO along light path and the vertical column amount HCHO vertical profile scattering by air molecules, aerosols, clouds surface albedo Clouds: primary source of error 1σ error in HCHO satellite measurements: 25–31% Recommended cloud cutoff: 50% Millet et al., JGR (in press).
Testing the Approach:Relating isoprene emission to HCHO column Observed M = 3.5 GEOS-Chem M = 3.6 ΩHCHO = SEisoprene+ B What drives variability in column HCHO? Test model HCHO yield Measured HCHO production rate vs. column amount PHCHO (1012 molec cm-2 s-1) INTEX-A ΩHCHO (1016 molec cm-2) ΩHCHO (1016 molec cm-2) Isoprene dominant source when ΩHCHO is high Other VOCs give rise to a relatively stable background ΩHCHO Not to variability detectable from space ΩISOP (1016 molec cm-2) HCHO yield from isoprene: Y = 1.6 ± 0.5 ΩHCHO variability over N. America driven by isoprene Millet et al., JGR (in press).
Using OMI HCHO to Define Spatial Distribution of Eisoprene HCHO columns measured with the OMI satellite instrument (summer 2005) Isoprene emissions from the MEGAN biogenic emission inventory (summer 2005) ? Comparison between emission inventory and HCHO columns from OMI indicates mismatch in hotspot locations Implications for O3, SOA production
Model of Emissions of Gases and Aerosols from Nature Environmental drivers (T, h, LAI, leaf age, …) Vegetation-specific baseline emission factors Land cover database MEGAN Isoprene emissions Guenther et al., Atmos. Chem. Phys., 6, 3181–3210, 2006.
OMI vs. GEOS-Chem with MEGAN Emissions OMI 44% lower Similarity in broad pattern (r2 = 0.80) … but fine-scale discrepancies
Relating HCHO Columns to Isoprene Emissions ΩHCHO = SEisoprene+ B Domain-wide ΩHCHO-Eisoprene relationship Local ΩHCHO-Eisoprene relationship
Spatial Patterns in Isoprene Emissions MEGAN w/ Community Land Model (CLM) Domain-wide ΩHCHO-Eisoprene relationship Local ΩHCHO-Eisoprene relationship Normalized OMI - MEGAN Normalized OMI - MEGAN
Normalized OMI – MEGAN July-August, 2005 MEGAN w/ Olson Land Cover MEGAN w/ CLM Land Cover Spatial Patterns in Isoprene Emissions Scale up OMI to remove overall bias Drive MEGAN with 2 land cover databases Olson [2001] Community Land Model (CLM) Large sensitivity to surface database used MEGAN higher than OMI over ‘hotspots’ such as the Ozarks, lower over deep South & Atlantic coast
Normalized OMI – MEGAN July-August, 2005 MEGAN w/ Olson Land Cover MEGAN w/ CLM Land Cover Emissions Overestimated in Ozarks & Other ‘Hotspots’ Bottom-up emissions are too high in Ozarks, Virginia Large emissions driven by oak tree cover, high temperatures OMI comparison suggests broadleaf tree emissions are overestimated Olson Broadleaf Trees
Normalized OMI – MEGAN July-August, 2005 MEGAN w/ Olson Land Cover MEGAN w/ CLM Land Cover Emissions Underestimated in Deep South & Atlantic Coast Bottom-up emissions are too low in deep South, Atlantic coast Underestimate of pine emissions in Southeast? Errors in vegetation cover? Underestimate of regional crop emissions also possible? (cotton, peanuts, tobacco) CLM Fineleaf Evergreen Trees CLM Crops
Conclusions OMI’s small footprint (13 x 24 km) allows us to define surface fluxes of trace gases with unprecedented spatial detail OMI HCHO columns are broadly consistent with state-of-the-art bottom-up emission inventories (R2 = 0.80) … but with important spatial differences! Bottom-up isoprene emission estimates are too high in the Ozarks and other ‘hotspots’ Overestimate of broadleaf tree emissions? Bottom-up isoprene emission estimates are too low over the deep South and along the Atlantic coast Underestimate of pine (possibly crop) emissions? Regional broadleaf tree coverage underestimated?
B. Yantosca, P. Palmer (now at Leeds), M. Fu, and other coworkers at Harvard Acknowledgements NOAA Postdoctoral Program in Climate and Global Change NASA/ACMAP OMI science team The INTEX-A science team