Evolution of Boater DNA: Quality Data in Marine Industry
280 likes | 370 Views
Explore the evolution of boaters over time, the utilization of quality data for new model development in the marine industry, and the influence of innovations in boating activities. Discuss the impact of quality data on product development and customer satisfaction, along with the future trends and challenges faced by boaters and manufacturers.

Evolution of Boater DNA: Quality Data in Marine Industry
E N D
Presentation Transcript
Bio Accounting & Logistics Background 6 Years in Medical Device Industry 10 Years in Marine Industry Director of Quality – BBG
Discussion Points Evolution of the “Boater” Utilization of Data Innovations Going Forward
Boater – 20 Years Ago • Customer – Boater who started small & worked his way into bigger boats – Boater DNA! • Use of Product • Recreation with family & friends including water skiing, fishing, etc… • Overnight boating, trips, etc… • Boat Content – Engine, gauges & radio • Expectations – Boat is functional
Boaters – Present Time • Customer – Boater DNA, Casual Boater, & Image Conscious Boater • Use of Product • Recreation with family & friends including water skiing, tubing, wake boarding, fishing, etc… • Day Boating • Content • Casual Boater – Matches features to needs for right price • Image Conscious Boater – Every bell and whistle possible • Expectations • Casual Boater – Boat is reliable, easy to use & safe • Image Conscious Boater – Boat is reputable, customizable & reliable
Internal Quality • Manufacturing Defects • Pros • Identify defect before boat ships • Ability to correct & use as training opportunity • Cons • Must stay on top of data
Internal Quality Internal Defects – Pareto for Improvement
Internal Quality - Stress Crack Pin Map Visual Defects
Internal Quality Hull Weight Variable Internal Data
Audits • Internal Audits & 3rd Party Audits • Compliance, NMMA, USCG, ISO, process, supplier installation, etc… • Pros • Used to validate processes & process controls • Audits minimize risk • Create containment windows • Cons • Audits are sporadic • Window of exposure might be present
Audits In Process Audit Results
Audits Compliance Audit Results
External Quality • Warranty • Pros • Failures give you the ability to create failure rates • Cons • Lagging indicator (12-18 months)
External Quality Begin To “Peel The Onion”
Competitive Analysis • Customer Questionnaires – JD Power, CSI • Pros • Quantify customer expectations • Data down to the model • Compare competitively • Cons • Lagging data indicator (300 days after retail sale) • Low response rate (Industry average 22%)
Competitive Analysis Utilize Data to Drive Segment, Model & Feature/Design Improvements
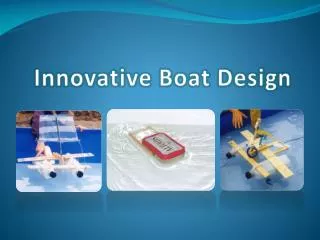
Innovations Chopping & Hand Laying Infusion Manufacturing Processes
Innovations Dash Instrumentation
Innovations Transom Seating Swim Platform Steps
Innovations Old School New School Water Sports
Innovations Dual Binnacle Bow & Stern Thruster Joystick Control Docking Controls
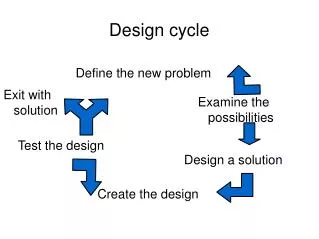
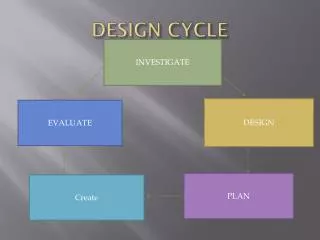
Going Forward • Boater Will Change • Must keep up with changes • Boats are More Complex • More opportunity for failure • Liability is higher • New Model Development • Takes 12-24 months