Download
1 / 20
200 likes | 275 Views
Optimization of mooring observations in the Arctic Ocean. G. Panteleev, International Arctic Research Center, UAF M. Yaremchuk, Naval Research Laboratory, Stennis Space Center D. Nechaev, Department of Marine Science, USM T.Kikuchi, Jamstec, Japan

E N D
Optimization of mooring observations in the Arctic Ocean G. Panteleev, International Arctic Research Center, UAF M. Yaremchuk, Naval Research Laboratory, Stennis Space Center D. Nechaev, Department of Marine Science, USM T.Kikuchi,Jamstec, Japan O.Francis, International Arctic Research Center, USF 2010 Ocean Sciences Meeting. Oregon 26 February 2010 8:45 AM - 9:00 AM
Motivation and goals • The AO Science Board has set the goal of creating the integrated Arctic Observing System (iAOOS) that includes the US Arctic Observing Network (AON) and other (Canadian and European) observational programs. • The development of an optimized Integrative Data Assimilation for the Arctic System (IDAAS) has been recommended for development by SEARCH in 2005. • The 4th International Polar Year (IPY) (2007-2009) was a pilot phase of designing and implementing an integrated ocean observing network in the AO and surrounding seas. • The 4th International Polar Year (IPY) (2007-2009) was a pilot phase of designing and implementing an integrated ocean observing network in the AO and surrounding seas Despite the leading role of the NSF and the NOAA, the existing networks for velocity observations are typically driven by individual investigator's interests, restricted by logistical and political constraints. • Ideally, a network designed for permanent hindcasting and forecasting of the AO circulation should be guided by a more objective strategy that optimizes the expenses of monitoring the AO in the context of climate change. • deal network design should be able to answer the following questions: • Motivated by this success and the major goals and recommendations of SEARCH, we work to develop an integrated set of assimilation procedures for the ice–ocean system that is able to provide gridded data sets that are physically consistent and constrained to the observations of sea ice and ocean parameters.
Motivation and goals • Ideally, a network designed for permanent hindcasting and forecasting of the AO circulation should be guided by a more objective strategy. A prerequisite for developing such a strategy is the ability to answer the following questions: - How many observations do we need to calculate reliable estimates of climatologically important quantities (CIQs) such as transport of Pacific water through particular sections, heat/salt content in certain basins, etc.? - How do observations in one region (e.g. velocity observations at particular sites in the Chukchi Sea) correlate with CIQs in another region (e.g. with Bering Strait transport)? • In what regions do we need improved coverage and what are the observational accuracy requirements? • Ect.
Project objectives are to: Develop an integrated set of objective procedures that may help: (1) To investigate efficiency of the existing observational programs in the AO. (2) To investigate how current and upcoming observational projects can improve hindcast and forecast of climate changes in the AO. (3) To analyze the efficiency of High Frequency Radar (HFR) data for operational hindcasting/forecasting of the coastal circulations and their possible impact on other observational projects.
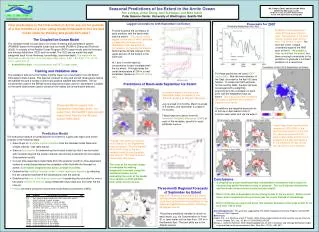
Approaches: OSSE (Observing System Simulation Experiments) OSSEsare widely used for skill assessment of data assimilation systems. Ocean OSSEs consist of controlled, quantitative assessments of the value/impact of a system of observations, determined through numerical ocean models of the governing dynamical processes. Typical OSSEs include five major steps: (1) identifying or generating an appropriate “Nature Run” (assumed truth) that is validated against available observations; (2) computing synthetic observations from the Nature Run; (3) characterizing observational error attributes to be applied to assimilated synthetic observations; (4) assimilating the simulated observations into a forecast model (typically different from the Nature model and referred to as the operational model); and (5) evaluating the added value of the assimilated observations in terms of increased analysis and forecast skill and other metrics. The schematic of an OSSE to be used in this project is shown in Figure 2.
Optimization of the mooring observations in the Bering Strait.Adjoint sensetivity analysis: Investigate region and optimized climatological surface velocity Climatological stream function Normalized adjoint sensetivity map of the BS transport to the mooring observations 4-5 regions with High correlation Between observations In these regions and BS transport
Optimization of the mooring observations in the Bering Strait.OSSE (twin data experiment): • Obtain optimized solution: • “true state” • 2. Extract data… from 4 moorings • 3. Assimilate these data and • reconstruct new circulation • Compare with “true state” • using some quantitative values: • a) Bering Strait transport • b) Accuracy of the reconstructed • circulation (True – Reconstructed) stream function in case of different locations of the moorings
Optimization of the mooring observations in the Bering Strait.Adjoint sensitivity analysis of the optimized circulation in 1990-1991: Observations In 1990-1991 Reconstructed optimal circulation
Optimization of the mooring observations in the Bering Strait.Adjoint sensitivity analysis of the optimized circulation in 1990-1991: Adjoint Sensitivity: d(BSTr)/dV(x,y) Mean V across A3 section Field study in 2007-2009 From 1990-1991 observations: Corr( V(A3),BSTr )=0.88 Corr( V(A2),BSTr )=0.94
Optimization of the HRF (radar) observations (Francis et al., 2010) Schematic showing desired coastal ocean observations in the Bering Strait region (Calder et al., 2009)
Optimization of the HRF (radar) observations (Francis et al., 2010)Adjoint sensitivity analysis: Adjoint sensitivity analysis of the integral surface circulation with respect to HFR surface velocity observation in the eastern Chukchi Sea identify that the highest correlation “mean score” has the HF observation in site (1). HFR observation in Red Dog, site (2), have a smaller correlation with surface circulation in the region. The score is estimated as squared sensitivity of the surface velocity relatively small changes in the “observed” surface velocity field. 1 Alaska Alaska 3 2 Alaska Alaska 4
Optimization of the HRF (radar) observations (Francis et al., 2010)OSSE: “True” (1)- ~0.26 (2)- ~0.38 (3)- ~0.76 (1+3) 0.12
Optimization of velocity observation in the AO Optimized mean surface velocities for 1900-2006 (result of reanalysis of the Arctic Ocean circulation
How can be used the optimized states? 2) Adjoint sensitivity study: optimized observations Dynamically induced correlation at different layers relatively observations of the transport along blue section. Control vector = B.C.
How can be used the optimized states? 2) Adjoint sensitivity study: optimized observations Dynamically induced correlation relatively observations of the transport along the several blue sections Control vector = I.C.
Dynamically induced correlation relatively observations of the transport along the several blue sections Control vector = I.C.
The Arctic Ocean 4Dvar data assimilation system and reanalysis of the • Arctic Ocean circulation are very important in order to • optimize observations in the Arctic Ocean • provide operational hindcast/forecast • - analysis of the climate changes • 2. Preliminary numerical experiments indicate that the current observations in the • Bering Strait are not optimal. “Spatially distributed” mooring deployment • allows accurate reconstructing Bering Strait transport and circulation in the region. • 3. Employing two models (SIOM and PIOMAS) for the reconstruction of the • ice-ocean circulation is a relatively cheap way to conduct ice-ocean reanalysis and • hindcast. But, it is still necessary to develop the conventional ice-ocean 4Dvar • data assimilation approach. New Ensemble 4Dvar data assimilation approach • is currently under development