Download
1 / 70
870 likes | 2.12k Views
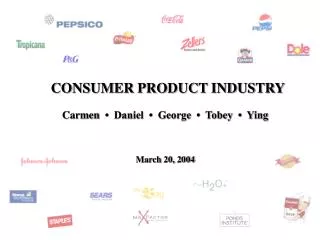
CONSUMER PRODUCT INDUSTRY. Carmen • Daniel • George • Tobey • Ying March 20, 2004. Agenda. Overview of Industry Company 1: Coca Cola Company 2 : Procter and Gamble Financial Highlights Risk Management. Consumer Product Industry. Definition:

E N D
CONSUMER PRODUCT INDUSTRY Carmen • Daniel • George • Tobey • Ying March 20, 2004
Agenda • Overview of Industry • Company 1: Coca Cola • Company 2 : Procter and Gamble • Financial Highlights • Risk Management
Consumer Product Industry • Definition: Consumer Products are everything tangible that the consumer might consider buying • Two Categories: Cyclical Goods: include vehicles, home furnishings, toys, jewelry, sporting goods and electronics Non-Cyclical Goods: include clothing, office supplies, personal care items and cleaning products.
Structure of Consumer Product Industry • Highly competitive and mature industry • Generates enormous portion of the gross domestic product • Pumps money into other industries • Sales are concentrated in the US, Japan & Western Europe • The populations of United States, Canada, Europe, and Japan make up less than 20% of the world's population, yet they consume the vast majority of consumer goods. • Individual consumers make up the majority of this industry’s customers • Marketing an individual product and promoting a brand name are key factors to succeed in this industry
Structure of the Consumer Product Industry • This is a great sector for times when the economy is slow because the companies depend less on the economy than the companies from other sectors. • Compare the 12 month percentage changes in indexes (2002) for consumer products with indexes of other sectors : INDEX12 mo. % change Non-Cyclical Consumer -3.22 Consumer Cyclicals -17.61 Energy -13.51 Financial -22.01 Health Care -19.41 Technology -37.73
Consumer Product Indices vs. S&P 500 during the last 12 months
Hot Industry: Home Appliance Companies Current Revenue Historical Profitability Stock Price($ in million)Growth(EBIT to Revenue) (01/31/2004) Electrolux Ab $23.14 $17,048.2 -2.0% 6.2% Whirlpool Corp. $75.95 $11,763.0 6.5% 7.3% Maytag Corp. $28.64 $4,791.9 2.7% 6.4% Salton Inc. $13.75 $933.4 -3.0% 4.8% Applica Inc. $8.09 $653.0 0.0% 1.3% National Presto Inds Inc. $37.2 $132.7 11.7% 14.6%
Cold Industry: Housewares and Accessories Companies Current Revenue Historical Profitability Stock Price ($ in millions) Growth ( EBIT to Revenue) (01/31/2004) Newell Rubbermaid Inc. $24.43 $7,670.8 7.9% 10.3% Blyth Inc. $33.27 $1,329.9 9.3% 11.2% Tupperware Corp. $17.65 $1,151.9 -1.0% 7.9% Waterford Wedgwood Plc $0.31 $966.8 -4.6% 2.3% Libbey Inc. $18.26 $491.2 2.9% 9.0% Oneida Ltd. $5.35 $454.1 -3.9% -2.7% Home Products Intl Inc .$1.48 $235.4 -0.2% 2.5%
Consumer Products in Canada • Canada's consumer products industry consists of furniture, clothing, textiles, toys, sporting goods, household goods, electronics, and appliances. • In 2000, furniture sales led the way with 10.7% growth, while clothing and general merchandise sales grew by 5.5% and 4.4%, respectively. • Over the five year period, from 1996 to 2000, the best performing export areas in the industry were furniture, with shipments increasing from $CDN 3.7 billion to $CDN 6.9 billion, and clothing, with shipments increasing from $CDN 1.6 billion to $CDN 3.0 billion.
Challenges & Opportunities of Consumer Product Industry • Industry consolidation takes place • Globalization is the primary avenue of growth for many businesses • Deflation is a more recent phenomenon impacting the way companies do business • Operating efficiencies, both supply- and demand-based, are the new trends • Effective brand management is critical to sustaining a competitive advantage. Successful brand development and management involve building brand strategies that focus on the customer experience. • Technology is a major enabler for companies today. It is allowing companies to operate in a more time-sensitive, cost-conscious, consumer-centric manner.
Governmental Regulations The production, distribution and sale in the United States of consumer products are subject to: • Federal Food, Drug and Cosmetic Act • Occupational Safety and Health Act • Lanham/Trademark Act • Various environment statutes • Various other federal, state and local statutes and regulations applicable to the production, transportation, sale, safety, advertising, labeling and ingredients of such products
Our Examples: Two Major Players • Coca-Cola • Procter & Gamble
Corporate Profile • World’s soft drink company • Invented by Atlanta pharmacist John Pemberton in 1886 • Publicly traded in 1919 • NYSE: KO • Credit Rating:
Products • Carbonated Soft Drinks • Non-Carbonated Beverages
Financial Structure Revenue Composition • Operating Revenues • Sale of beverage concentrates & syrups • Sale fountain syrups to fountain retailers • Sale of finished beverages • Revenues from Financial Activities • Interest Income • Equity Income
Financial Structure Cost Structure • Cost of Good Sold • Selling, General, & Admin. Expenses • Other Expenses (i.e. Interest Expense)
Structure Cost Stock Options (in millions)
Stock Options Stock Option Plans • Max 120 millions shares • Granted to employees at fair market value at date of grant
Stock Options Stock option activity (in millions):
Stock Options Restricted Stock Award Plans • Max 29 million shares • Granted to certain officers and key employees • Entitled to vote and receive dividends
Risk Management Risks • Interest rates • Foreign Exchange rates • Commodity prices • Other market risks
Interest Rate Management Strategies: • Monitors % mix of • fixed-rate and variable-rate debt • term debt and non-term debt • Use interest rate swap agreements
Interest Rate Management Short-Term Borrowings: • Commercial Paper (in millions)
Interest Rate Management Long-Term Debt (in millions):
Interest Rate Management Long-Term Debt (in millions):
Interest Rate Management Interest rate swap: • Maturity less than 2 years
Interest Rate Management Value at risk: • Confidence level: 95% • Time horizon: one-week period “Any increase in net interest expense would not have material impact on our financial statements”
Foreign Currency Management 5 geographic segments: net operating revenues
Foreign Currency Management • Use 52 functional currencies • Weakness in one $$ is often offset by strengths in another
Foreign Currency Management To hedge: Forecasted cash flows denominated in foreign $$ Derivative instruments: • Forward exchange contracts • currency options (euro and Japanese) • 1 ~ 2 years maturity
Foreign Currency Management Hedging effects: • Gains/losses on foreign currency cash flow hedges (in millions):
Foreign Currency Management To hedge: Net investment in certain major $$ Derivative instruments: • Forward exchange contracts Hedging effects:
Foreign Currency Management Value at risk: • Confidence level: 95% • Time horizon: 1-week period “Fair value of foreign currency derivatives would decline by less than …”
Risk Management Accumulated Other Comprehensive Income (in millions):
BOARD FINANCE COMMITTEE CHARTER INTEREST RATE & FOREIGN CURRENCY MANAGEMENT Risk Management Process
Financial Committee Charter Purpose: Aid the Board to oversight financial affairs Membership: • No fewer than 3 members • Appointed/Removed by the Board Responsibilities: • Formulate financial policies • Report financial conditions • Prepare annual budgets
Procter & Gamble • Exchange: NYS • Ticker: PG • Established in 1837 • Began as a small, family operated soap and candle company • Based in Cincinnati, Ohio • Markets almost 300 products to more than five billion consumers in 140 countries
P&G Operations • 5 global business units • $43 Billion in Sales
Billion-Dollar Brands • Pampers • Tide • Ariel • Always • Pantene • Charmin
Billion-Dollar Brands • Bounty • Iams • Crest • Folgers • Pringles • Downy
Business Unit Breakdown P&G $43.3 Billion in Sales Baby & Family Care $9.93 Billion in Sales Diapers, Tissue Brands: Pampers, Charmin, Bounty Fabric & Home Care $12.6 Billion in Sales Detergent, Bleach, Household cleaners Brands: Cheer, Mr. Clean, Febreze Beauty Care $12.22 Billion in Sales Cosmetics, Hair Products, Skin Care, Femine Care Brands: Pantene, Tampax, Clairol, Ivory Soap Health Care $5.8 Billion in Sales Pet Health/Food, Oral Care, Drugs Brands: Iams, Crest, Vicks, Metamucil, Pepto-Bismol Snacks & Beverages $3.24 Billion in Sales Snacks and beverages Brands: Folgers, Pringles, Sunny Delight
Cost Structure/Performance • P&G annualized total shareholder return • nearly 17% over the past 20 years • Strategy for future growth: • Best in branding • Innovation: creating new brands and categories • Scale