Download
1 / 59
660 likes | 845 Views
Teaching Computational Thinking: Examples from Weather and Climate Modeling. “Essentially, all models are wrong, but some models are useful.” - George E. P. Box (1951). Teresa Eastburn & Randy Russell National Center for Atmospheric Research University Corporation for Atmospheric Research.

E N D
Teaching Computational Thinking: Examples from Weather and Climate Modeling “Essentially, all models are wrong, but some models are useful.” - George E. P. Box (1951) Teresa Eastburn & Randy Russell National Center for Atmospheric Research University Corporation for Atmospheric Research NSTA Denver, December 12, 2013
Computational Thinking Solving problems, designing systems, and understanding human behavior by drawing on the concepts fundamental to computer science. ~ Jeannette Wing, Carnegie MellonIntegrating the power of human thinking with the capabilities of computers. ~CSTA Steven Gilbert NSTA Press
Here’s What We’ll Be Covering What is a climate model, why are supercomputers needed, and what do they do and not do? The Systems Game – Why systems thinking matters 3. What’s the difference between a weather model vs a climate model (initial value problem vs. a boundary value problem)? Chaos Theory Climate simulations for your you and your students to explore
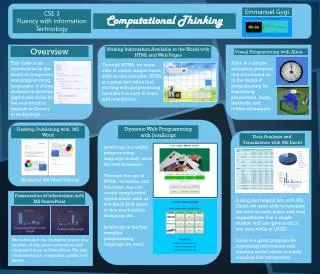
Spark – science education at NCAR National Center for Atmospheric Research in Boulder
NCAR Mesa Lab in Boulder Public and School Group Visits spark.ucar.edu/visit
spark.ucar.edu/events/workshop- computational-thinking-nsta-regional-2013
Evolution of Climate Models Credit: Intergovernmental Panel on Climate Change (IPCC) Fourth Assessment Report (AR4): Working Group 1: Chapter 1, page 99, Fig. 1.2
Climate Model Components Credit: UCAR (Paul Grabhorn)
Climate Model Components Credit: UCAR
Progress in climate models occurs as a result of: Like a sturdy 3-legged stool • Observations • Theory • Numerical Modeling “Science presumes that things and events in the Universe occur in consistent patterns that are comprehensible through careful, systematic study.” ~ AAAS THEORY OBSERVATION MODELING
Models are today’s tech test tube for the Earth system. Image source adaption: NOAA Images adapted from K. Dickson, NOAA
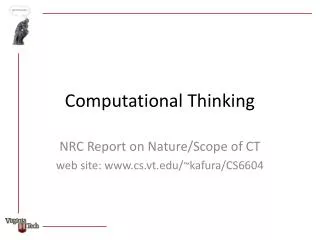
Climate Models = Virtual Earth • Now we can model various components (parts or subsystems) in the Earth system (atmosphere, ocean, sea ice, land physics…) and how they will interact and respond over time to a natural or human-made forcing agent. Atmosphere Circulation & Radiation Land Physics Sea Ice Ocean Circulation
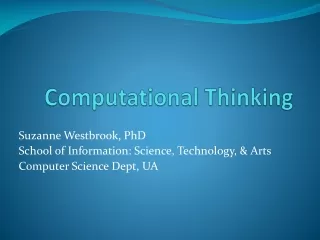
Improving Resolution of Climate Models • Grid Cell Sizes • 1990s (T42) • 200 x 300 km • 120 x 180 miles • 2000s (T85) • 100 x 150 km • 60 x 90 miles Credit: Warren Washington, NCAR
Improving Resolution of Climate Models Credit: Intergovernmental Panel on Climate Change (IPCC) Fourth Assessment Report (AR4): Working Group 1: Chapter 1, page 113, Fig. 1.4
Vertical Resolution of Climate Models • Vertical Layers • 1990s • 10 layer atmosphere • 1 layer “slab” ocean • 2000s • 30 layer atmosphere • 30 layer ocean Credit: UCAR
Hexagonal Grid and Sub-grids Credit: UCAR (Lisa Gardiner)
Using Models in Education “Essentially, all models are wrong, but some models are useful.” - George E. P. Box (1951)
Weather vs Climate ProjectionsPhysics is Physics, Right? Why do we think we can make meaningful 100 year climate projections when we can’t forecast the day-to-day weather a month from now? Initial Value Problem vs Boundary Value Problem
Weather Model vs Climate Model Compare and Contrast • Differences (and similarities) between • Weather vs. Climate Models • Area Covered (scale) • Resolution – distance (spatial) and time (temporal) • Timespan covered by model runs • Impacts on computing resources needed, • time required to run models
Weather Model vs Climate Model Area Covered Weather Model – up to about continental size scale Climate Model – global size scale Larger area requires either more computing power/time or lower resolution (spatial and/or temporal)
Weather Model vs Climate Model Resolution and Precision • Weather Model • resolution typically about 3-10 km • timesteps of hourly to 6 hours, forecast for next 3-4 days • Climate Models • resolutions from about 25-30 km up to 100 (or a couple hundred) km • running computer models can take days or weeks, which would be impractical for weather models • Precision – why Wx forecast for Christmas is suspect, but temperature next July is reliable (relationship to chaos)
Weather Model vs Climate Model Timeframe Climate Projection – decades to centuries or longer (climate is usually defined as at least 30 years of observations) Weather Forecast – hours to days (up to about 10 days)
Resolution: Spatial & Temporal (Time) • Timesteps can be a few minutes to 12 hours or more • Durations can be hours to centuries
Resolution and Computing Power Double resolution – increase number of nodes – more calculations! One Dimension 2 times as many nodes Two Dimensions 4 times as many nodes
Resolution and Computing Power What if we increase model to three dimensions (space) plus time?
Resolution and Computing Power What if we increase model to three dimensions (space) plus time? 16 times as many nodes – 16x computing power required! This is why we need supercomputers!
Chaos • Chaos – 10-day forecast reliability limit • Ensemble runs of models – tipping points – arctic ice melt – sea ice and open water albedo images • Why Wx forecast for Xmas is suspect, but temperature next July is reliable (relationship to chaos)
Source: Meehl et al NCAR
Which of the following cannot be addressed by a physical climate model? • How would Earth’s average surface temperature be expected to change if carbon dioxide doubled? • How much carbon dioxide and methane will humans add to the atmosphere during each of the next five decades? • Can cosmic rays from the sun affect clouds and hence play an important role in climate variability and change? • Is it possible to learn about past climate variations by gathering data from holes drilled deep into the Earth’s crust? • All above can be addressed by physical climate science.
How will GHG vary? F = P xgxexfxd • F = total GHG emission rate • P = population size (global and/or national) • g = per capita gross world/domestic capital • e = energy use per $ of gross world/national product • f = GHG emissions per unit energy use • d = deforestation effects
Ensemble Projections of Global Temperature for Various Emission Scenarios Future Projections Verses Forecasts Source: UCAR/NCAR
Climate Models help with… DETECTION - Is the planet’s climate changing significantly? ATTRIBUTION – If so, what is causing the change? Nature? Human Actions? Both? PROJECTION – What does the future hold for Earth’s climate?
Models in the Standards Next Generation Science Standards
Greenhouse Effect Review • CO2 absorbs heat in the atmosphere • When heat accumulates in the Earth system, the average global temperature rises
Increased CO2 & the Greenhouse Effect • When the amount of carbon dioxide in the atmosphere increases, • average global temperature rises. • Longwave radiation emitted by CO2 is absorbed by the surface, • so average global temperature rises
Emissions -> More CO2 in Air -> Higher Temperature 18° 15°
Climate Sensitivity - definition Whenever the amount of carbon dioxide in the atmosphere doubles, average global temperature rises by 3 degrees Celsius. 18° 18° 15° 15°
Learning from the Past (ice cores) Ice age Ice age Ice age Ice age
CO2 Emissions – Where are we now? In 2013, CO2 emissions are around 10 gigatons (GtC) per year (10,000 million tons in units used on this graph)
CO2 in Atmosphere – Where are we now? • For hundreds of thousands of years, CO2varied between 180 and 280 parts per million, beating in time with ice ages • Since the Industrial Revolution, CO2 has risen very rapidly to about 400 ppm today 396 ppm in 2013 iceage iceage iceage iceage
Math of Climate Sensitivity When the CO2 concentration in the atmosphere doubles, temperature rises by 3°Celsius (about 5.4°F) Examples: • If CO2 rises from 200 ppmv to 400 ppmv, • temperature rises 3°C • If CO2 rises from 400 ppmv to 800 ppmv, • temperature rises 3°C • Note: as CO2 rises from 200 to 800 ppmv • (800 = 4 x 200), • temperature rises 6°C • ( = 2 x 3 degrees, not 4 x 3 degrees)
Climate Sensitivity Calculator demo spark.ucar.edu/climate-sensitivity-calculator
Climate Sensitivity Calculator Activity Use the calculator (previous slide) to determine the expected temperature for the various CO2 concentrations listed in column 1 of the table above (students fill in column 2); then have them graph.