Large Prototype Beam Test Micromegas analysis
120 likes | 282 Views
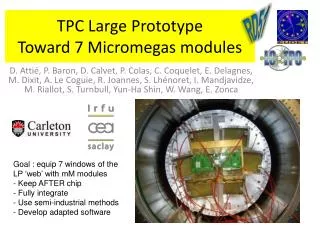
Large Prototype Beam Test Micromegas analysis. D. Attié, P. Colas. B=0 resolution study Drift velocity measurements. The Large Prototype. Panels: in 2008-2009: 1 panel at a time in the centre of the detector. Start with standard pads Continue (after a week November) with a resistive panel.

Large Prototype Beam Test Micromegas analysis
E N D
Presentation Transcript
Large Prototype Beam Test Micromegas analysis D. Attié, P. Colas B=0 resolution study Drift velocity measurements
The Large Prototype TPC Analysis
Panels: in 2008-2009: 1 panel at a time in the centre of the detector. Start with standard pads Continue (after a week November) with a resistive panel. Others are dummy. Also plans for trying a multichip InGrid+TimePix panel in 2009 One panel successfully mounted week 44 TPC Analysis
FIRST DATA TPC Analysis
cosmiques faisceau Beam witdth in x and in z: 3.9 mm TPC drift length : 56.85 cm (measured with cosmic-rays) 56.937 cm (survey) TPC Analysis
Measured drif velocity (Edrift = 230 V/cm, 1002 mbar) : 7.56 ± 0.02 cm/µs Magboltz : 7.548 ± 0.003 pour Ar:CF4:isobutane:H2O/95:3:2:100ppm Drift time (µs) Z (mm) arbitrary origin TPC Analysis
Résiduals from barycentre at 40 cm : s=450 µ (expected from diffusion: 315 microns * √40 cm / √22 = 400) x-x(track) (mm) TPC Analysis
distortions: residuals line by line TPC Analysis
Displacement wrt vertical straight line (microns) Pad line number Rms displacement: 9 microns TPC Analysis
Drift velocity measurement (using B=1T data) : shoot the beam at 5 different points (by sliding the TPC in the magnet) and measure relative times x x x x x Runs used (100 ns shaping time) Time of highest charge hit in time bins (40 ns) TPC Analysis
Results: Vdrift (140 V/cm) = 5.82 +- 0.02 cm/µs (Magboltz pure T2K 5.94 – with 120 ppm H2O 5.87) Vdrift (230 V/cm) = 7.68 +- 0.03 cm/µs (Magboltz pure T2K 7.71 – with 120 ppm water 7.59) Note that for longer shaping times, the measured time just adds the shaping. Example : at 500 ns shaping time, just add 10 time bins. TPC Analysis
Conclusion Still a lot of work and not much time... But very beautiful data! Get some results for TIPP09 and forthcoming conferences Take new data with new electronics (by-passed shaping) and an additional panel (resistive ink) TPC Analysis