Download
1 / 40
400 likes | 422 Views
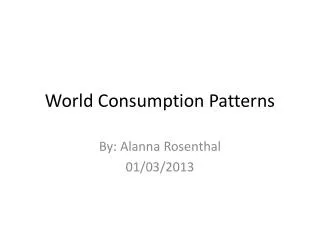
This article explores the reasons behind the increasing global consumption of sugar, including the role of added sugars in modern food supply and the maldistribution of sugar intake. It also discusses diet sweetener patterns, policies such as taxes and labeling, and the historical evolution of caloric beverages.

E N D
Global Sugar Consumption Patterns, Policies, Taxes, and Other Issues Barry Popkin W. R. Kenan, Jr. Distinguished University Professor Department of Nutrition Gillings School of Global Public HealthSchool of MedicineDepartment of Economics The University of North Carolina at Chapel Hill
Outline: Why is This Occurring? • In-depth look first: added sugar in modern food supply, the ignored role of fruit juice concentrate and fruit juice as major added sugars in food and beverages with all the ‘natural healthy organic’ connotations and lack of measurement of dynamic additions of added sugar to our food supply • US Added sugar intake and an ignored issue: maldistribution of intake of added sugar • Global consumption patterns • Diet sweetener patterns and trends • Policies being utilized: taxes, labeling, marketing controls, restrictions in selected environments
Remarkably Short History for Caloric Beverages: Might the Absence of Compensation Relate to This Historical Evolution? Earliest possible date Definite date US Soda Intake 52/gal/capita (2004) US Coffee Intake 46 gal/capita (1946) Juice Concentrates (1945) US Milk Intake 45 gal/capita (1945) Modern Beverage Era 10,000 BCE - present 200,000BCE - 10,000 BCE Origin of Humans Pre-Homo Sapiens Coca Cola (1886) Pasteurization (1860-64) Carbonation (1760-70) Liquor (1700-1800) Lemonade (1500-1600) Coffee (1300-1500) Brandy Distilled (1000-1500) (206 AD) Tea (500 BCE) Wine (5400 BCE) Wine, Beer, Juice (8000 BCE) Beer (4000 BCE) Milk (9000 BCE) Water, Breast Milk 2000 BCE 200000 BCE Homo Sapiens 100000 BCE Beginning of Time 0 200000 BCE 10000 BCE BCE AD
1. Sweeteners in Our Food Supply About 550,000 foods and beverages exist in our consumer packaged food and beverage system in the US. About 100,000 have unique ingredients. Using these data from a nationally representative sample of about 60,000 households who daily scan all food purchases’ bar codes, we can identify the foods with sweeteners. Two sets of data—older published paper on difference from US NHANES data and our data with ingredients searched. Then new results—in press only
Sweeteners in Our Food Supply Key word searches at the ingredient list of each product Low-calorie sweeteners: artificial sweetener, aspartame, saccharin, sucralose, cyclamate, acesulfame K, stevia, sugar alcohols (i.e. xylitol) and brand name versions of each sweetener (i.e. Splenda) Caloric sweeteners: fruit juice concentrate (not reconstituted), cane sugar, beet sugar, sucrose, glucose, corn syrup, high fructose corn syrup, agave-based sweeteners, honey, molasses, maple, sorghum/malt/maltose, rice syrup, fructose, lactose, inverted sugars Caloric Sweetener Low-calorie Sweetener
Sources of Sweeteners Low calorie sweetener Caloric sweetener LCS and CS All Foods and Beverages that Contain Any Sweetener • Means per capita for beverages (mL/d) and foods (g/d). LCS, low-caloric sweetened beverages or foods; CS, caloric-sweetened beverages or foods • Piernas et al, Pediatrics Obesity 8:294-306
The % of Uniquely Formulated Foods and Beverages in the US Food Supply Containing Sweeteners (Mutually Exclusive Categories) NS= Nutritive/Caloric Sweetener, NNS= Non-nutritive/non-caloric sweetener, FJC= Fruit Juice Concentrate (excluding lemon/lime and when reconstituted) (not for use or quotation) (Popkin and Hawkes, Lancet Diabetes for fall/winter)
% of Uniquely formulated CPG Purchases by Weight in GramsContaining Sweeteners (Weighted to Be Nationally Representative) NS= Nutritive/Caloric Sweetener, NNS= Non-nutritive/non-caloric sweetener, FJC= Fruit Juice Concentrate (excluding lemon/lime and when reconstituted) (not for use or quotation) (Popkin and Hawkes, Lancet Diabetes for fall/winter)
% of CPG Purchases by Calories Containing Sweeteners Weighted to be Nationally Representative (Excludes Low Calorie Sweeteners by Using Kcal) NS= Nutritive/Caloric Sweetener, NNS= Non-nutritive/non-caloric sweetener, FJC= Fruit Juice Concentrate (excluding lemon/lime and when reconstituted) (not for use or quotation) (Popkin and Hawkes, Lancet Diabetes for fall/winter)
2. United States: Added Sugar and Beverages: Patterns and Trends • US trends overall • Changes in the distribution
Hook consumers early, gain a consumer for life: “Babies who drink soda during their early formative period are much more likely to fit in during those awkward preteen and teen years”
Adjusted Mean Calories of Daily Added Sugars by US Individuals for Foods and Beverages • 1977 to 2003 change • Beverages:+3.6kcal/year • Foods: +.6kcal/year • 2003 to 2012 change • Beverages:-5.6 kcal/year • Foods: -1.2 kcal/year • 1977 to 2003 change • Beverages:+3.5kcal/year • Foods: +.9kcal/year • 2003 to 2012 change • Beverages:-3.9 kcal/year • Foods: -.3kcal/year Children 2-18 Adults 19 and Older Adjusted by Gender, Race, Income and Education, Weighted to Be Nationally Representative
Trends in Quintiles of Added Sugar Distribution in the US (Excludes Fruit Juice Concentrate), Kcal/Day. Note the large skewed distribution. q1 q2 q3 q4 q5 A. Children aged 2-18 B. adults 19 and older Powell et al, (not for use or quotation)
3. Global Trends— Both in Kcal by Region and Country and Volume • Euromonitor passport data: excellent on trends, levels appear to be under-reportedas expected as they do not obtain data from all companies. Pilot study worked with them. they obtain kcal from each country for most beverages. • Kcals based on calories from beverages in each country. They get this off websites and nutrition facts panels. If anything, these are a major undermeasurement as many local companies underreport their kcal, total sugar and other data.
Daily Calories Sold per Capita per Day from all Sugar-Sweetened Beverages in 2014 by Region (Weighted by Population) Source: Euromonitor Passport International with country-specific kcal data added (not for use or quotation) (Popkin and Hawkes, Lancet Diabetes for fall/winter)
Caloric Trends in Sugar-Sweetened Beverage Sales by Region, 2009-2014 Source: Euromonitor Passport International with country-specific kcal data added (not for use or quotation) (Popkin and Hawkes, Lancet Diabetes for fall/winter)
Calories Sold per Capita per Day from Sugar-Sweetened Beverage by Country, 2009-2014 • Source: Euromonitor Passport International with country-specific kcal data added (not for use or quotation)
Supplemental Figure 1. Daily Calories Sold per Capita from all Sugar-Sweetened Beverages in 2014, Highest Selling Countries Source: Euromonitor Passport International with country-specific kcal data added (not for use or quotation) (Popkin and Hawkes, Lancet Diabetes for fall/winter)
Daily Calories Sold per Capita from all Sugar-Sweetened Beverages in 2014, Lowest Selling Countries Source: Euromonitor Passport International with country-specific kcal data added (not for use or quotation) (Popkin and Hawkes, Lancet Diabetes for fall/winter)
Trends 2000-2010 in Calories per Ounce Sold: Global, the US, Brazil, and China World US Brazil China Source: Kleiman et al (2011) Obesity Reviews
Brazilian Trends 2000-2010 in Daily Calories Source: Kleiman et al (2011) Obesity Reviews Bottled Water Carbonates Fruit/Vegetable Juice Sports and Energy Drinks
Chinese Trends 2000-2010 in Daily Calories Source: Kleiman et al (2011) Obesity Reviews
Volume (mL) Trends in Sugar-Sweetened Beverage Sales per Capita per Day in China, 2000-2014 Source: Euromonitor Passport International with country-specific kcal data added (not for use or quotation) (Popkin and Hawkes, Lancet Diabetes for fall/winter)
4. Low-caloric Sweeteners(Diet Sweeteners but with a few Kcals)
Examples of Major Low Calorie Sweeteners Used in Diet Beverages (Now Dozens of Low Calorie Sweeteners) Sweetened diet beverages: Complex. Our work in process suggests it is the diet linked with these beverages that determines the effect and not the diet beverages (see Mattes and Popkin, AJCN (2009) 84) Acesulfame K (Sunett)—approved 1988 Aspartame (Nutrasweet, Equal)—approved 1981 Cyclamate - approved1958 Saccharin (Sweet’n Low)—approved 1977 Sucralose (Splenda)—approved 1998 Neotame (Nutrasweet manufactured)—approved 2002 Stevia (Truvia)—approved 2008
Liters of Diet Beverages Sold per Capita in 2014 by Region • (not for use or quotation) (Popkin and Hawkes, Lancet Diabetes for fall/winter)
mL of Diet Beverages Sold per Capita per Day by Region, 2000-2014 (not for use or quotation) (Popkin and Hawkes, Lancet Diabetes for fall/winter)
Trends in Diet Beverage US Among US adults(≥19), 1977-2008 Source: nationally representative NHANES data
Trends in Diet Beverage US among US Children(2-18), 1977-2008 Source: nationally representative NHANES data
Large-Scale Regulatory Options • Taxation of sugar - ideal, very unlikely • Taxation at the manufacturer level of kcal in SSB’s • Marketing controls • Front-of-the-label profiling linked with marketing controls • Controls in selected institutions, e.g. schools • Food system changes
Taxation • Egypt: SSB taxes: 25%, low consuming, no evaluation; Barbados 10% tax begins Aug 1, 2015 • France and Mexico SSB: about 10% tax, Mexican evaluation strong positive results but cannot reveal details until we publish. On website showed release: . Preliminary results show a 6 percent average decline in purchases of taxed beverages over 2014 compared to pre-tax trends. This difference accelerated over 2014 and the reduction compared to pre-tax trends reached 12% by December 2014. All socioeconomic groups reduced purchases of taxed beverages. Reductions were higher among lower socio-economic households, averaging 9% decline over 2014 compared to pre-tax trends and up to a 17% decline by Dec 2014. Results also show roughly a 4 percent increase in purchases of untaxed beverages over 2014, mainly driven by an increase in purchased bottled plain water (tap water intake is not collected). • Hungary—no evaluation • Chile: 8% SSB began Jan 1, 2015 coupled with marketing and FOP controls which will slowly be instituted over 4 years. Will work on rigorous evaluation • Selected Pacific Islands
The Food Environment: Labeling and Claims • Front-of-the-package—confusingGDA’s of industry vs. • positive health food labeling: Singapore, Malaysia, Mexico, Thailand, China have or are finalizing. India is beginning. Law in Netherlands/Czech/others E Europe, Scandanavian Tick, new Health Stars Australia and New Zealand • negative logo: Ecuador exists as law (now planning implementation with its own version of negative logo) and Chile (law passed, notimplemented yet) identify foods with unhealthy levels added sugar, sodium, saturated fat. Complex traffic lights. Negative on multiple items. • ban images: Ecuador banned animal characters, cartoon personalities, celebrities to promote junk food. • Ideal: Link labeling with marketing and later taxation. Some countries are doing this.
LabelingUnhealthy Foods 10 % of front surface of the package One for each high “critical nutrient”
The Food Environment: Marketing Controls Hampered by Big Food and Beverage Politics • Chile: implementation of law to ban toys, control marketing of unhealthy foods high in saturated fat, add sugar and sodium in all media channels; a 3-year implementation in phases begins July 1, 2016. • Brazil: comprehensive exemplary law held up by attorney general and legal challenges • Peru and Ecuador: strong laws, implementation not complete • Industry voluntary self-regulation seems to be the major approach and no evaluation has shown this to be successful in any LMIC or any high income country. • South Korea: ban for TV and internet specific food categories during kids’ programs and 5-7pm. • Thailand planning marketing ban linked with FOP labeling
The Food Environment: School Restrictions Major Institution • Ideal—ban/allow same healthy/unhealthy foods and beverages • Schools: banning of junk foods/SSBs completely (Peru, Ecuador, Costa Rico, UAE, Singapore, Western Pacific), mainly (Mexico, Thailand) • In-school marketing: banned • Mexico: reformulation of milk from full fat to 1.5% fat for all government programs ( 20 million affected). • Brazil: most exemplary. Note below under food systems. Also ban SSB’s and snacks in many states. Indonesian snack law like Brazil law. • Philippines: banned SSB’s
Food Systems • Brazil: most effective but needs serious impact evaluation. Schools must purchase 30% of food from local smaller family farms/cooperatives. Also 70% of food must be a basic unprocessed food. No evaluation so unclear impact. • Singapore: put all hawkers into centers when can control the environment, have access to them for various programs. • The push for farmers markets and farm to household sales minimal in LMIC’s (a high income country phenomena mainly) • Urban and school gardening: limited systematic efforts • Mainly ignoring retail sector and restaurant/fast food other than the Singapore effort and the front of the package labeling efforts
Information and Education • To date no evidence from any country that large-scale nutrition education has affected either what people eat or drink or how they move. Thailand appears the strongest. • Large-scale: Thailand unique effort at the village level with a focus on reducing waist circumference (Flat Belly Network), also reducing sugar and fat • Dominant media today: food industry and retailers and food service sector. Trivial level of public health-related nutrition education • Nutrition education in schools in many countries pushed. No focus on cooking or other skills and minimal impact shown to date. • Few countries push for healthy food in hospitals and clinical diet and physical activity counseling (e.g. Brazil, Thailand) • Workplace: limited efforts (e.g. Singapore)
Special Programs for Controlling Overweight and Obesity Problems • Sweet Enough Network • Thai People Flat Belly Network
LMIC’s Are Beginning to Take Serious Large-Scale Action • The need and the will to take action is increasing among LMIC’s • Mexico, Ecuador, Chile, Peru, Thailand, Singapore, and the Western Pacific Islands are just the beginning of this. • Evidence is needed: serious push for rigorous evaluation is essential. • A need to create one food and beverage standard and use across all controls: marketing, front-of-packing profiling, taxation