Testing
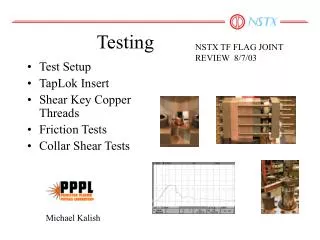
Testing. NSTX TF FLAG JOINT REVIEW 8/7/03. Test Setup TapLok Insert Shear Key Copper Threads Friction Tests Collar Shear Tests. Michael Kalish. Test Setup. MTS Hydraulic Test Stand Plots Load vs Deflection up to 100,000 lbf Provides Cyclical Testing Capabilities.

Testing
E N D
Presentation Transcript
Testing NSTX TF FLAG JOINT REVIEW 8/7/03 • Test Setup • TapLok Insert • Shear Key Copper Threads • Friction Tests • Collar Shear Tests Michael Kalish
Test Setup • MTS Hydraulic Test Stand • Plots Load vs Deflection up to 100,000 lbf • Provides Cyclical Testing Capabilities
Objective: To determine pull out strength as well as to prove durability of insert over 50,000 cycles TapLok Inserts installed in spare lengths of conductor Test samples prepared to be identical to actual conductor TapLok Pull Tests
Specimen in Test Fixture TapLok Pull Tests
TapLok Pull Tests • Static tests were performed on KeenSerts and both .687” and .562” long TapLok Inserts (13 TapLoks & 8 KeenSerts) • The design settled on the .562” TapLoks and results presented are only that insert • Only .562” long TapLoks were cycled • Average pullout force for .562” TapLok was 12,700 lbf with a corresponding ultimate shear stress of 29.9 KPSI (compares conservatively with design allowables)
Static Pull Test Plot A graph of force vs deflection is generated for each sample Displacement vs Force Curve for Tap Lok #4, 3rd Sample Peak Force = 12,500 lb
Cyclical Testing, TapLok • Using same test setup medium length (.562”)Tap Lok inserts were cycled then pulled • Test pieces were cycled at 5,000 to 6,000 lbf for 50,000 cycles or greater • Test sample was heated to 100 C during cycling • Cycled with 1 Hz Sine Wave • Thermal loading accounts for 83% of the cyclical load • Thermal loading occurs for only approximately 1,000 of the 50,000 cycles but testing applied full loading for all 50,000 cycles
Cyclical Testing Plot • Example of force vs deflection curve for cycling of inserts • Shaded area may indicate drift or creep (first run exhibited a “negative creep” drift)
Cyclical vs Static Pull Test • Fatigued Insert Pullout (bottom trace) vs Unfatigued Insert Pullout (top trace) • Fatigued = 12,380 lbf • Unfatigued = 13,380 lbf
Results Cyclical Pull Tests for TapLok • Cycled Samples pull out strength relatively unchanged • Yield strength values averaged 82% of Tensile strength • Thermally cycled samples did not vary from unheated samples
Shear Key Copper Threads, Static and Cyclical Testing, Test Setup
Shear Key Copper Threads, Static and Cyclical Testing • Objective: To verify the strength of the threaded holes in the conductor for the shear key hardware under both static and fatigue conditions • Test samples using conductor copper were prepared with the same hole / thread specifications as in the actual conductor • Cyclical testing of copper threads was performed at room temperature
Static Pull of Copper Threads There was a strong correlation between pull out force and the number of threads pulled A-1 12,500lbs peak, 8 Threads Pulled A-2 12,620lbs peak, 8 ½ Threads Pulled A-3 13,120lbs peak, 9 Threads Pulled A-4 12,500lbs peak, 8 Threads Pulled A-5 10,880lbs peak, 7 Threads Pulled A-6 12,380lbs peak, 8 Threads Pulled
Plot of Force vs Deflection Shear Key Copper Threads 04_24_03 Tapped Copper NO Insert A-4, Peak Force = 6.25v or 12,500lbs
Shear Key Copper Threads, Cyclical Results • Samples pulled after cycling showed no degradation in pull out strength • Pull out strength correlated with the number of threads pulled • Yield Strength for both cycled and uncycled samples averaged 82% of the pullout strength • Tests were performed on copper samples subjected to oven thermal cycling with no noticeable degradation to pull out strength • Average pullout force for static test of threads was 12,780 lbf with a corresponding ultimate shear stress of 29.0 KPSI (compares conservatively with design allowables)
Shear Key Copper Threads, Cyclical Plot Example of force vs deflection curve for cycling of inserts 7/21/03 Bare Copper Bar 2 Sample #3 (cycled at room temperature) Force = 5,010 to 6,000 lbs
Shear Key Copper Threads, Results Cyclical • No appreciable degradation in the pull out strength of samples subjected to 50,000 cycles • One sample subjected to 233,000 cycles with same result
Friction Test • Objective: To characterize the COF for the flag electrical faces under varying preloads. • Two horizontal load cells measure compressive force provided by eight 3/8th inch bolts • Specimens are machined and plated after each run • Vertical load is applied to offset middle block
Friction Tests Results, Plot • Plot of Force vs Distance • Force is recorded at point where nonlinear behavior begins
Friction Test Results (cont.) • Mean COF = .41 • Min. Value = .39 • Results consistent for varying compressive loads
Objectives: To characterize the shear strength and elasticity of the TF Shear Collar both under static and fatigue conditions To correlate shear strength and clamping pressure Collar Shear Test
Collar Sample Test Setup • Test Fixture Designed to provide compression as sample is tested in shear or cycled • Dual Load Cells measure compressive load and the MTS load cell measures shear load
Plot of Shear Collar Static Sample Tests • Clamping pressure vs shear failure loads show good correlation
Static Collar Testing Result • Initial collar test consistently failed at the epoxy to steel interface • Grooved plates then an improved epoxy were tested resulting in improved shear stress results (22%) and maximized system strength (failure no longer at adhesive layer) • Five sets of samples tested, only sets 4 and 5 which represent the final configuration are reported on here
Test Samples, Static Tests Adhesive interface to steel plates is no longer the failure mode after addition of slots and improved epoxy
Plot of Shear Collar Cyclical + Static Sample Tests • Pink data points represent samples broken after cycling • Greater scatter may be the result of shear test done at different compression than cycling
Collar Cyclical Testing Results • Seven collar samples cycled at over 50,000 cycles • Six of Seven samples survived four of which were cycled at elevated stress values (higher than nominal design value) • One sample failed after 2,800 cycles at 1,800 psi. The clamping load on this sample was only 226 psi and the cycling rate was high, 1HZ • One sample under went 233,000 cycles at 1,300 psi and low clamping load with no failure. • Another sample was cycled at 1,600 psi for 123,600 cycles without failure (1,000psi clamping)