Download
1 / 41
410 likes | 428 Views
Explore operational climate monitoring, drought tracking, heavy precipitation, and user needs. Learn about SEMDP's satellite-based solutions and BoM's observational products in detailing past weather and climate extremes.

E N D
Space-based Weather and Climate Extremes Monitoring (SWCEM) Demonstration Project (SEMDP) WorkshopJakarta, Indonesia, 19-22 March 2018 Operational Climate Monitoring at the Australian Bureau of Meteorology Yuriy Kuleshov
Outline • Climate services at the Australian Bureau of Meteorology (WMO RA-V) • Climate monitoring – current status / products • Drought • Heavy precipitation • User needs
Introduction - SEMDP Although it is likely that current satellite products alone may be not fully adequate from the beginning, the quasi-operational use of the satellite products in a demonstration phase will, in conjunction with surface based observations, help to improve quality and contributions of the satellite products themselves.
SEMDP Products The 2-year SEMDP will concentrate on products at national and regional levels: monitoring accumulated heavy precipitation and droughts; making best use of existing and newly developed satellite derived products and time series of measurements; making best use of products that combine satellite information with in-situ and/or model reanalysis data; recommendations as to which products should be transitioned from research to operations, including an assessment of those products.
Australian BoM Operational Products:Climate and Past Weather Drought monitoring Heavy precipitation http://www.bom.gov.au/climate/
Australian BoM Operational Products:Major Climate and Weather Extremes BoM reports on long-term extremes such as drought; and daily extremes if they are record-breaking in intensity or spatial extent. BoM typically reports on • drought, • heatwaves, • heavy rainfall extreme, • cold events. BoM may also report on • high fire indices, • high wind, • severe frost events.
Australian BoM Operational Products:Major Climate and Weather Extremes BoM issues a dedicated Drought Statement that is released every month to report on how the rainfall in the previous month may have affected long-term deficiencies in rainfall. This statement has been running since the mid-1960s and was first issued at the request of the Australian government in response to the severe drought of the time. A Weekly Rainfall Update is also issued to provide commentary on how recent rainfall has affected drought conditions.
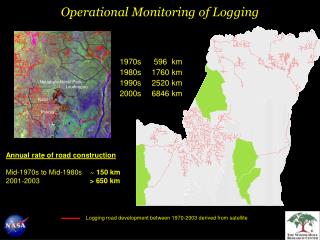
Australian BoM Operational Products:Maps of Recent and Past Conditions Maps of longer term totals, anomalies, percentages of mean, and percentiles including rainfall, temperature, vapour pressure, normalized difference vegetation index and solar exposure are updated monthly with the latter two fields satellite derived products, the rest being gridded fields derived from station data.
Australian BoM Operational Products:Maps of Recent and Past Conditions Monthly NDVI Average for Australia Daily solar exposure for Australia
Australian BoM Operational Products:Maps of Recent and Past Conditions Maps Based on surface-based observations Based on a standard 30-year climatology (1961 – 1990)
Climate Data Distribution of stations – poor coverage in central area of Australia
Rainfall Observations and Products • Rainfall observations • Australia - large country; stations sparsely distributed • WMO RA-V Pacific Island Countries - limited number of stations • Satellite products – global coverage • Products • Summaries • Maps • Statistics (methodology varies) • Means of delivery – NMHS website
Climate Drivers El Niño Southern Oscillation (ENSO) is one of the major drivers of climate variability over Australia. Historically drought are more likely during El Niño years with severe flooding more likely during La Niña years. Another major driver of climate variability over Australia is the Indian Ocean Dipole (IOD) which is monitored closely. The MJO is also monitored. Weather systems: frontal systems; tropical cyclones
Operational Criteria to Determine Extremes Current observations are interpolated onto grids and compared to the whole record to determine extreme events. Nationwide rainfall grids start in 1900. Nationwide temperature grids start in 1910. Drought is monitored through percentile thresholds, 10th and 5th percentile over a wide area for at least a three month period.
Operation Criteria to Determine Extremes The graph is based on a percentile analysis. The percentiles for each day are calculated using all the daily observations of rainfall on record for each month. The Bureau's record starts in 1900 for rainfall. For example, the rainfall percentiles for 20 Feb 2018 are calculated by comparing the rainfall on 20 Feb 2018 against the rainfall on all Feb days between 1 Feb 1900 and 20 Feb 2018. The observations for all the days on record in that month are then ranked from driest to wettest for rainfall and then broken into 100 equal groups. Highest on record; above 99th percentile; above 97th percentile
Monitoring of the Extremes 1.4.1. tools used Rainfall and temperature are monitored using conventional station-based observations which are interpolated onto gridded maps. 1.4.2. target time/space scales Rainfall and temperature are observed daily and then monthly and longer averages are taken. 1.4.3. target latency of “diagnostics” Rainfall and temperature grids are monitored daily. Monthly, seasonal and annual summaries are usually out on the first working day of the month.
Australian BoM Operational Products:Daily Solar Exposure The solar exposure values have been derived for most days since the start of 1990 from a sequence of satellites: GMS-4, GMS-5, GOES-9, MTSAT-1R, MTSAT-2 and, since 23 March 2016, Himawari-8. The satellite model's horizontal resolution is 0.05 degrees in longitude and latitude, or approximately 5 km. The accuracy of the model's daily estimates of insolation is estimated by comparison with independent measurement by Bureau ground instruments.
Australian BoM Operational Products:Monthly NDVI Average The Normalised Difference Vegetation Index (NDVI) grids and maps are derived from satellite data. The data provides an overview of the status and dynamics of vegetation across Australia, providing a measure of the amount of live green vegetation. The satellite data comes from the Advanced Very High Resolution Radiometer (AVHRR) instruments on board the National Oceanic and Atmospheric Administration (NOAA) series of satellites.
Drought Monitoring The Bureau’s Drought Watch service is delivered through Climate Services The majority of products are generated using automated systems, requiring only minor overheads in terms of production costs. The main exceptions are the Drought Statement and Weekly Rainfall Update, which include substantial text components. Underlying the Bureau’s Drought Watch are spatial analyses of rainfall at 0.05°×0.05° resolution.
Drought Monitoring Typical information available for a “drought” period (e.g. for the 9 months August 2012 to April 2013 focussed on Victoria)
Drought Monitoring Rainfall totals (mm)
Drought Monitoring Rainfall deciles
Drought Monitoring Rainfall percentages
Australian Climate and Weather Extremes Monitoring System BoM website http://www.bom.gov.au/climate/extremes/
Australian Climate and Weather Extremes Monitoring System Extremes Tables Extremes Maps Extremes Graphs Climate Records
Daily Rainfall Extremes for Australia The graph is based on a percentile analysis. The percentiles for each day are calculated using all the daily observations of rainfall on record for each month. The Bureau's record starts in 1900 for rainfall. For example, the rainfall percentiles for 20 Feb 2018 are calculated by comparing the rainfall on 20 Feb 2018 against the rainfall on all Feb days between 1 Feb 1900 and 20 Feb 2018. The observations for all the days on record in that month are then ranked from driest to wettest for rainfall and then broken into 100 equal groups. 20.7 % Percentage area above 97th percentile (%)
Daily Rainfall Extremes for Australia 12.6 % Percentage area above 99th percentile (%)
Daily Rainfall Extremes for Australia 0.6 % Percentage area highest on record (%)
Daily Rainfall Extremes for Australia Daily Rainfall Extremes 24 hours on 18 Feb 2018
Tropical Cyclone Kelvin Localised flooding occurred in Kalumburu in the north Kimberley and over the west Kimberley. Widespread road flooding occurred throughout Broome. The Great Northern Highway sustained significant damage due to the flooding and was closed in parts between Sandfire Roadhouse and Willare Roadhouse, including into Broome and over the Roebuck Plains.
User Perspective • In developing a model for improved drought services the Bureau of Meteorology has undertaken three rounds of stakeholder engagement and review, in the form of surveys, interviews and workshops. • 2011 - Snowy Mountains Environmental Consulting (SMEC) for the Water Division • 2012 - Sinclair Knight Merz (SKM) to develop a concept paper in support of an improved drought service • 2013 – 2014 workshop of major service providers, clients and stakeholders
User Perspective Drought forecasting – The need for accurate, targeted and seamless forecasts was highlighted. Users desired a seamless approach to forecasts across intraseasonal (a few weeks), seasonal (3 to 6 months) and longer-term (multi-year) periods. Different drought indices and improved drought monitoring – The focus on rainfall deciles was felt to be limited in terms of the application to hydrological drought and agricultural drought. Indices which took into account other factors, such as temperature and evaporation, and varying timescales were sought by users.
User Perspective Standardised Precipitation Index (SPI), which has become the default for international drought monitoring across climate zones and between countries and includes measures of ‘wet’ periods. Localisation of data – users wanted information available for their locality. Drought service integration – The need for a drought portal to integrate information, with related tools such as seasonal forecasting information for drought.
User Perspective • The potential for satellite rainfall data to better inform the spatial variability of rainfall received, especially in areas of high geographical variability or where there may be gaps in the ground recording network and help respond to concerns around ‘lines on the map’.
Summary • Drought monitoring • Heavy precipitation monitoring • User perspective • Derived products and indices e.g. SPI • Satellite products – global coverage