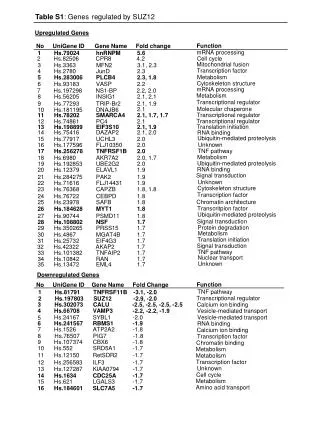
Download

1 / 17
170 likes | 277 Views
This comprehensive guide covers the system architecture, implementation details, and various use cases of an IPTV quality monitoring system, including data collection, network processing, error localization, and correlation with weather phenomena. It also emphasizes the importance of integration with customer support and network topology mapping for efficient problem resolution. The system aims to enhance user experience and streamline decision-making processes. Future work includes automating personal TV activity data storage for tailored viewing experiences.

E N D
Group 1.7 Denos, Khalid, Chen, Zhou, Peng 217, 991, 037, 337 , 641 Image from: https://www.tpg.com.au
Outline • Introduction • System architecture • System implementation • Used cases • Conclusion
Internet Protocol Television (IPTV) Voice Service IP Network TV Service Data Service Image from: http://joannekraft.com
IPTV Monitoring Set Top Box STB STB Server SNMP Trap Server SNMP Agent SNMP Agent • Collect data • Queue management • Filter and Parsing • Store • Data Source • Periodical • Triggered by user • (Channel Zapping)
System Implementation • Data Source (SNMP Traps) Network Processing Network level Video decoding Application level • Control using SNMP
System Implementation • Data Volume • 180 Bytes/msg, 100,000 subscribers
System Implementation • Data Volume • 180 Bytes/msg, 100,000 subscribers
System Implementation (server side) • Data Analysis • Diagram for historical data • Diagram for real time data Database APP Queries Data
Use Cases • Application-Level IPTV Quality Monitoring • Integration with Customer Support • Network Topology Mapping • Error Localization • Correlation with Weather Phenomena
App-level IPTV Quality Monitoring Establish a baseline level of application-level metrics and network-related metrics Detect any significant increase in errors = Experience of low quality
Integration with Customer Support Usual Case Cost long time to describe the problems, and very likely in a wrong way!! After Integration • Advantage: • Guide further decisions to mediate the problem • Shorten the delay between a decision and its results
Network Topology Mapping Unavailable precise network topology map create network graph using IP addressing hierarchy It allows visual exploration of network hierarchy and quick identification of problematic nodes by their color.
Error Localization Heat map of error severity visualize the percentage of errors well suited for visual analytics allow the patterns to be discovered quickly Horizontal streaks Long running underperformance of an individual BNG Vertical streaks A connection between independent BNGs Or a similar usage pattern
Correlation With Weather Phenomena Natural causes Lightning strikes Create a large amount of impulse noise IPTV systems without FEC are especially susceptible to such disturbance Highly localized and little can be done Weather Radar Map Explain away the unavoidable and focus on the preventable
Conclusion • Other cases Conveys information about how the subscribers use and interact with the IPTV system Rate for individual TV shows & Imply undesirable contents • Future work Automation The personal TV activity data could in the future be stored without anonymization.