FGT Layout Simulation Results
This document outlines the simulation results and optimization strategies for the Forward GEM Tracker (FGT) disks within the MIT FGT project, aiming for improved electron and hadron discrimination. It details detector requirements, disk geometries, and alignment strategies while ensuring minimal material interference with track paths. The report highlights the importance of disk positioning for adequate tracking performance across various z-vertex ranges. Additionally, it evaluates the response of GEM detectors and occupancy metrics to enhance tracking efficiency and charge sign reconstruction.

FGT Layout Simulation Results
E N D
Presentation Transcript
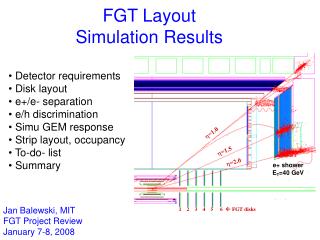
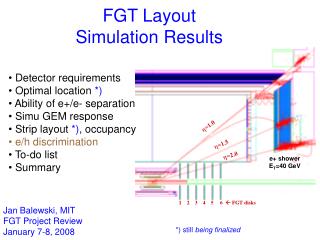
=1.0 =1.5 =2.0 1 2 3 4 5 6 FGT disks e+ shower ET=40 GeV FGT Layout Simulation Results • Detector requirements • Optimal location *) • Ability of e+/e- separation • Simu GEM response • Strip layout *), occupancy • e/h discrimination • To-do list • Summary Jan Balewski, MIT FGT Project Review January 7-8, 2008 *) still being finalized
FGT Requirements • Reconstruct charge of e+, e- from W decay for PT up to 40 GeV/c • Aid electrons / hadrons discrimination • Allow for uniform performance for z-vertex spread over [-30,+30] cm • Fit in geometrical envelope vacated by the West Forward TPC • Benefit from other ‘central’ trackers: IST, SSD • Relay on vertex reconstruction and Endcap shower-max hit • Relay on Endcap towers for energy reconstruction • Minimize amount of material on the path of tracks • Align FGT segmentation with TPC sector boundaries and Endcap halves • Assure relative alignment vs. TPC is double with real particles
Optimization of FGT Disks Location in Z a) Barrel EMC Used TPC volume nHits>=5 Endcap EMC =1.0 Zvertex=0cm =1.5 =2.0 SSD IST1,2 beam 1 2 3 4 5 6 R-‘unconstrained’ FGT disks Zvertex=+30cm Zvertex=-30cm c) b) 1 2 3 4 5 6 1 2 3 4 5 6 FGT disks geometry: Rin=7.5cm, Rout=41cm, Z1…Z6=60…150cm, Z=18cm • 5 hits required for helix reco • FGT sustains tracking if TPC provides below 5 hits • use TPC, SSD,IST for • Zvertex <~0 and <~1.3 • displaced • -30< Z_vertex < +30 cm
Optimization of FGT Disk Radii Rxy – representation Endcap Used TPC volume nHits>=5 track = 1.7 =1.0 Zver=0cm =1.5 =2.0 TPC If nHit>5 Endcap SMD FGT 1 2 3 4 5 6 1 2 3 4 5 6 FGT SSD IST1,2 =1.7 ‘generous’ FGT disks geometry : Rin=7.5cm, Rout=41cm, Z1…Z6=60…150cm, Z=18cm Rxy – Z representation • Optimization Criteria • Each track must cross the vertex and Endcap EMC • 6 FGT disk are needed to provide enough hits for tracks at all and all z-vertex • Single track crosses less than 6 FGT disks • Relay on TPC & SSD at ~1 Vertex
Revised Compact FGTevery disk plays a role Critical FGT coverage depends on Z-vertex Rin=18cm, Rout=37.6cm, Z1=70cm, …,Z6=120cm, Z=10 cm ZVERTEX=-30cm ZVERTEX= 0cm ZVERTEX=+30cm Rxy (cm) Endcap TPC FGT Vertex track
FGT Enables Reco of Sign of e+,e- 2mm Sagitta (cm) Sagitta (cm) 2mm Endcap SMD hit =1.5mm Y/cm Good Q-sign Wrong Q-sign 100cm reco track 1 of reco track Sagitta=2mm Limit for pT track Tracks uniform in and pT 40cm 3 FGT hits =70m 20cm X/mm Vertex =200m 1.0 2.0 mm 0
Track & Charge Sign Reco Efficiency FGT geometry: Rin=18cm, Rout=37.6cm, Z1=70cm, …,Z6=120cm, Z=10 cm • N0 – thrown electrons, ET=30 GeV • N1 – reco tracks (<3 mrad) • N2 – reco tracks w/ correct charge sign • (pT from 2D circle fit, ET constrain not used, 1 track/event) • Track reco efficiency >~80% for up to 2.0 • Wrong charge reco <~20% only for > 1.5
Large A(W-) for >1.5, FGT Essential W- PT>20 GeV/c Charge Reco Efficiency Using: TPC+vertex+ESMD+SSD+IST+FGT *) Reasonable yield Largest A 2008 Configuration TPC+vertex+ESMD low efficiency *) geometry : Rin=7.5cm, Rout=41cm, Z1…Z6=60…150cm, Z=18cm
Detailed Simulation of GEM Response R-axis strip 2 mm phi-axis strip 1 mm (R*) 40m • ionization and charge amplification • spatial quantization on GEM foil grid • charge collection by strip planes • 1D cluster reconstruction • Add: time dependence pileup simu Realistic MIP charge profile collected by R- and -strips 1D Cluster finder resolution similar to Ferm-Lab test beam results
FGT Strip Layout *) y Bottom R-layer pitch 800m x 326 R-strips X z 15 deg Endcap halves y Top -layer 949 -strips pitch 600m Essential for PT reco ~ 50% transparency x FGT quadrant boundaries match to Endcap segmentation needed for 3D track recognition, resolving ambiguities Compact FGT Rin=18cm, Rout=37.6cm, Z1=70cm, …,Z6=120cm, Z=10 cm *) close to final
Estimation of Strip Occupancy tracks 2 1 1 -strips 400 m pitch R-strips 45 deg long 0 1 track/strip per 1000 minB events tracks Track rate per strip for minB PYTHIA events @ s500 GeV Based on FGT geometry: Rin=15cm, Rout=41cm R=41cm R=15cm 0.8 0.4 0 =0 deg =90 • pileup from minB events dominates • 1.5 minB interactions/RHIC bXing • 300nsec response of APV • 3 bXings pile up • Total pileup of 5 minB events per trigger event • 1 track per FGT quadrant per minB event • (scaled from simu below) • Cluster size: 1mm along , 2mm along R • Cluster occupancy per triggered event per quadrant • -strips (span ~43cm)1.2% occupancy • R-strips (span 25cm) 4% occupancy • (uncertainty factor of 2) minB PYTHIA event @ s=500 GeV
e/h Discrimination : PYTHIA Events Isolation & missing-PT cuts suppress hadrons by ~100 Hadrons from PYTHIA M-C QCD events e+, e- from PYTHIA M-C W-events
e/h Endcap EMC additional factor of 10 Pre Showers Shower Max Post Shower =2.0 30 GeV 0 GeV e+ =1.08 + GeV Simu of Endcap response to Electrons (black) & charge pions (red) with ET of 30 GeV e+ + Endcap + e+ Projective tower Shower from electron E=30 GeV ~15 GeV ET Trigger threshold
Real Electrons Reconstructed in Endcapproof of principle Endcap-based cuts TPC 6<P<8 GeV/c TPC 10<P<14 GeV/c e+, e- • MIP e+, e- • MIP Identified e+,e- in p+p 2006
To-do List • completion of detailed (a.k.a. ‘slow’) simulator for GEM response • develop 3D tracking with pattern recognition, integrate w/ STAR tracking • include pileup from 3 events in reco of physics events • implement and optimize full array of e/h discrimination techniques • completion of full W event simulation and comparison to full hadronic QCD events simulation • determine background contribution from Z0 and heavy flavor processes, above pT>20 GeV/c
FGT Simulation Summary • Will be able to reconstruct charge of e+, e- from W decay for PT up to 40 GeV/c with efficiency above 80% • There is enough information recorded to discriminate electrons against hadrons • Allow for uniform performance for z-vertex spread over [-30,+30] cm, OK • Will fit in geometrical space • Will use hits from IST, SSD • Will relay on vertex reconstruction and Endcap shower-max hit & energy • FGT quadrants are aligned with TPC sector boundaries and Endcap halves • FGT disks 1 & 2 overlap with TPC allowing relative calibration
Track Reco Strategy 1 2 3 4 5 6 FGT • Select EMC cluster with large energy (ET>15 GeV) • Find Endcap SMD cluster location ( x~y~5cm) • Find transverse vertex position (x~y~0.2mm) • Eliminate all FGT hits outside the cone: vertex SMD hit • Resolve remaining ambiguities (if any) by • comparing R vs. charge 2 1 x 5 x 4 x 3
TPC reco with 5 points ‘regular’ tracking 5-hits tracking ‘regular’ tracking 5-hits tracking
Alternative Snow-flake Strip Layout 326 R-strips 12-fold local Cartesian ref frame Top -layer 949 -strips pitch 600m As in Proposal Bottom R-layer pitch 800m
FGT Material budget UPGR13, maxR=45 cm 0.5*Xo Z vert= - 30cm Z vert= 0cm Z vert= + 30cm Non-FGT material upfront Non-FGT material upfront Non-FGT material upfront 0 0.5*Xo 0
Study of stability of efficiency • Studied variations of efficiency (shown in proposal): • degraded FGT cluster resolution (80m 120m, OK) • reduced # of FGT planes (6 4 , bad, too few hits/track) • degraded transverse vertex accuracy (200m 500m, OK) • FGT cluster finding efficiency (100% 90%, OK , details)
Detailed Simulation of GEM Response (1) Latice attractors spaced 130 m Charge from this hexagon is attracted by the hole Hole in GEM foil amplifies charge cloud Primary ionization R-axis strip Pitch=800m xhit phi-axis strip pitch=600m Amplified signal is displaced best • ionization and charge amplification • spatial quantization on GEM grid • charge collection by strip planes • 1D cluster reconstruction
Simulated FGT Response (2) 14 prim pairs/track 14 prim pairs/track 22 eV/pair 22 eV/pair (760 eV/ track) R* =40m 32 any pairs/track R=122m GEM response Test beam data 1D Cluster finder resolution