
Uploaded by
sharla
1 SLIDES
106 VIEWS
10LIKES
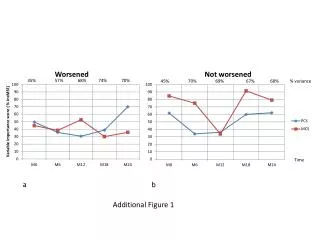
Analyzing Time Variance and Additional Figures with .45% to .70% Variance Rate
DESCRIPTION
Explore the impact of variance rates ranging from .45% to .70% on time analysis and additional figures. Understand how variance affects data accuracy and decision-making processes. This study delves into the correlation between variance and outcomes, providing valuable insights for informed decision-making.
Download
1 / 1
Download Presentation 
Analyzing Time Variance and Additional Figures with .45% to .70% Variance Rate
An Image/Link below is provided (as is) to download presentation
Download Policy: Content on the Website is provided to you AS IS for your information and personal use and may not be sold / licensed / shared on other websites without getting consent from its author.
Content is provided to you AS IS for your information and personal use only.
Download presentation by click this link.
While downloading, if for some reason you are not able to download a presentation, the publisher may have deleted the file from their server.
During download, if you can't get a presentation, the file might be deleted by the publisher.
E N D


More Related