Download
1 / 16
160 likes | 226 Views
Discussing response times, highway statistics, and factors affecting reaction time when driving, including insights on speed measurement and observation techniques.

E N D
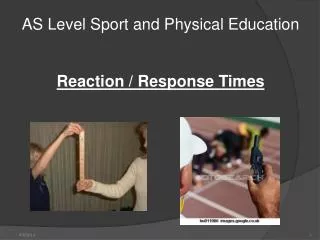
Response Time (Reaction time) Transportation: Ch. 1, Act. 1
What do you think? • How fast do you think you would be able to respond to an emergency situation on the road? • The average response time for most drivers is about 0.33s.
What do you think? • How far can you go in 0.33s? • At 30 mph, this is 14 feet. • At 60 mph, this is __ feet. • This is BEFORE you try to stop the car.
Response Time • What factors affect response time? • Alertness • Drugs & alcohol • Age • Distractions • Conversations (cell phone and others) • Eating & drinking • Putting on make-up • Rubber necking
Highway Statistics – 15-20 • 2004: • 24 percent of fatally injured drivers aged 15-20 were intoxicated (blood alcohol concentration [BAC] greater than 0.08 percent). • 2003: • 6.3 percent of licensed drivers, • 13.6 percent of all highway fatal crashes.
Highway Statistics – 15-20 • 2002: • Crash severity increases with alcohol involvement. • 2 percent of drivers in property-damage-only crashes had been drinking. • 4 percent of young drivers in injury crashes had been drinking. • 23 percent of young drivers in fatal crashes had been drinking. • ~ $40.8 billion = estimated cost of police-reported young driver crashes.
Highway Statistics – 15-20 • Young drivers do only 20 percent of their driving at night, but over half the crash fatalities of adolescent drivers occur during nighttime hours. • The risk of a crash involving a teenage driver increases with each additional teen passenger in the vehicle.
Highway Statistics – 15-20 • Research shows that the cognitive effects of conducting a conversation on a wireless telephone can decrease situational awareness and that wireless telephone use can increase reaction time. • A 2001 study, "Driver Situational Awareness and Carphone Use," reported that drivers engaged in wireless conversations were unaware of traffic movements around them.
Average vs. Instantaneous Speed? • Average Speed: Speed = Total distance traveled / total time. v = d / t
Average vs. Instantaneous Speed? • Average Speed: • Average speed is independent of the path traveled. It does not necessarily reflect your speed at a given moment in time. • Instantaneous Speed: The speed that you are traveling at a specific moment in time.
Average vs. Instantaneous Speed? • Which does your speedometer measure: Average or Instantaneous speed? • Which one includes the stop lights and traffic: Average or Instantaneous speed?
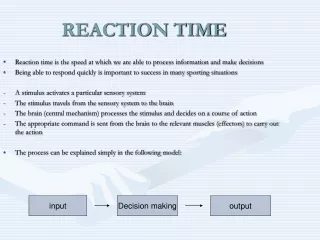
Observing Speed • Speed can be observed and represented in a couple of ways. • Motion Diagrams: A strobe representation through pictures of a moving object taken at a specific time interval. • Graphs: Speed can be determined through graphical analysis where the distance or velocity of an object may be measured vs. time.
Motion Diagrams Constant Speed: Positive Acceleration: Negative Acceleration:
Graphical Anaysis Distance Time
Graphical Anaysis Velocity Time