Download
1 / 30
300 likes | 397 Views
Analyze Lincoln Company's financial statements for 2003 and 2002 using basic analytical procedures, solvency analysis, and profitability analysis. Explore changes in assets, liabilities, and equity, as well as income statement variations.

E N D
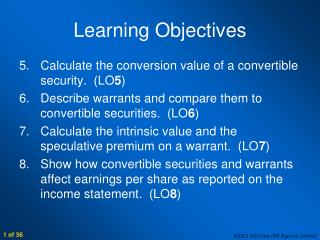
Chapter 16 Financial Statement Analysis 1. Basic Analytical Procedures 2. Solvency Analysis 3. Profitability Analysis 4. Summary of Analytical Measures 5. Corporate Annual Reports Learning Objectives
Lincoln CompanyComparative Balance SheetDecember 31, 2003 and 2002 Increase (Decrease) 2003 2002 Amount Percent Assets Current assets $ 550,000 $ 533,000 $ 17,000 3.2% Long-term investments 95,000 177,500 (82,500) (46.5%) Fixed assets (net) 444,500 470,000 (25,500) (5.4%) Intangible assets 50,000 50,000 — $1,139,500 $1,230,500 $ (91,000) (7.4%) Liabilities Current liabilities $ 210,000 $ 243,000 $ (33,000) (13.6%) Long-term liabilities 100,000 200,000 (100,000) (50.0%) $ 310,000 $ 443,000 $(133,000) (30.0%) Stockholders’ Equity Preferred stock, $100 par $ 150,000 $ 150,000 — Common stock, $10 par 500,000 500,000 — Retained earnings 179,500 137,500 $42,000 30.5% $ 829,500 $ 787,500 $42,000 5.3% $1,139,500 $1230,500 $(91,000) (7.4%)
Lincoln CompanyComparative Balance SheetDecember 31, 2003 and 2002 Increase (Decrease) 2003 2002 Amount Percent Assets Current assets $ 550,000 $ 533,000 $ 17,000 3.2% Long-term investments 95,000 177,500 (82,500) (46.5%) Fixed assets (net) 444,500 470,000 (25,500) (5.4%) Intangible assets 50,000 50,000 — $1,139,500 $1,230,500 $ (91,000) (7.4%) Liabilities Current liabilities $ 210,000 $ 243,000 $ (33,000) (13.6%) Long-term liabilities 100,000 200,000 (100,000) (50.0%) $ 310,000 $ 443,000 $(133,000) (30.0%) Stockholders’ Equity Preferred stock, $100 par $ 150,000 $ 150,000 — Common stock, $10 par 500,000 500,000 — Retained earnings 179,500 137,500 $42,000 30.5% $ 829,500 $ 787,500 $42,000 5.3% $1,139,500 $1230,500 $(91,000) (7.4%) Horizontal Analysis: Current year (2003) $550,000 Base year (2002) $533,000 = 103.2% Increase amount $17,000 Base year (2002) $533,000 = 3.2%
Lincoln CompanyComparative Income StatementDecember 31, 2003 and 2002 Increase (Decrease) 2003 2002 Amount Percent Sales $1,530,500 $1,234,000 $296,500 24.0% Sales returns 32,500 34,000 (1,500) (4.4%) Net sales $1,498,000 $1,200,000 $298,000) 24.8% Cost of goods sold 1,043,000 820,000 223,000 27.2% Gross profit $ 455,000 $ 380,000 $ 75,000 19.7% Selling expenses $ 191,000 $ 147,000 $ 44,000 29.9% Administrative expenses 104,000 97,400 6,600 6.8% Total operating expenses $ 295,000 $ 244,400 $ 50,600 20.7% Operating income $ 160,000 $ 135,600 $ 24,400 18.0% Other income 8,500 11,000 (2,500) (22.7%) $ 168,500 $ 146,600 $ 21,900 14.9% Other expense 6,000 12,000 (6,000) (50.0%) Income before income tax $ 162,500 $ 134,600 $ 27,900 20.7% Income tax 71,500 58,100 13,400 23.1% Net income $ 91,000 $ 76,500 $ 14,500 19.0%
Lincoln CompanyComparative Income StatementDecember 31, 2003 and 2002 Increase (Decrease) 2003 2002 Amount Percent Sales $1,530,500 $1,234,000 $296,500 24.0% Sales returns 32,500 34,000 (1,500) (4.4%) Net sales $1,498,000 $1,200,000 $298,000) 24.8% Cost of goods sold 1,043,000 820,000 223,000 27.2% Gross profit $ 455,000 $ 380,000 $ 75,000 19.7% Selling expenses $ 191,000 $ 147,000 $ 44,000 29.9% Administrative expenses 104,000 97,400 6,600 6.8% Total operating expenses $ 295,000 $ 244,400 $ 50,600 20.7% Operating income $ 160,000 $ 135,600 $ 24,400 18.0% Other income 8,500 11,000 (2,500) (22.7%) $ 168,500 $ 146,600 $ 21,900 14.9% Other expense 6,000 12,000 (6,000) (50.0%) Income before income tax $ 162,500 $ 134,600 $ 27,900 20.7% Income tax 71,500 58,100 13,400 23.1% Net income $ 91,000 $ 76,500 $ 14,500 19.0% Horizontal Analysis: Current year (2003) $1,498,000 Base year (2002) $1,200,000 = 124.8% Increase amount $298,000 Base year (2002) $1,200,000 = 24.8%
Lincoln CompanyComparative Balance Sheets December 31, 2003 December 31, 2002 Amount Percent Amount Percent Assets Current assets $ 550,000 48.3% $ 533,000 43.3% Long-term investments 95,000 8.3 177,500 14.4 Fixed assets (net) 444,500 39.0 470,000 38.2 Intangible assets 50,000 4.4 50,000 4.1 $1,139,500 100.0% $1,230,500 100.0% Liabilities Current liabilities $ 210,000 18.4% $ 243,000 19.7% Long-term liabilities 100,000 8.8 200,000 16.3 $ 310,000 27.2% $ 443,000 36.0% Stockholders’ Equity Preferred stock, $100 par $ 150,000 13.2% $ 150,000 12.2% Common stock, $10 par 500,000 43.9 500,000 40.6 Retained earnings 179,500 15.7 137,500 11.2 $ 829,500 72.8% $ 787,500 64.0% $1,139,500 100.0% $1230,500 100.0%
Lincoln CompanyComparative Balance Sheets December 31, 2003 December 31, 2002 Amount Percent Amount Percent Assets Current assets $ 550,000 48.3% $ 533,000 43.3% Long-term investments 95,000 8.3 177,500 14.4 Fixed assets (net) 444,500 39.0 470,000 38.2 Intangible assets 50,000 4.4 50,000 4.1 $1,139,500 100.0% $1,230,500 100.0% Liabilities Current liabilities $ 210,000 18.4% $ 243,000 19.7% Long-term liabilities 100,000 8.8 200,000 16.3 $310,000 27.2% $ 443,000 36.0% Stockholders’ Equity Preferred stock, $100 par $ 150,000 13.2% $ 150,000 12.2% Common stock, $10 par 500,000 43.9 500,000 40.6 Retained earnings 179,500 15.7 137,500 11.2 $829,500 72.8% $787,500 64.0% $1,139,500 100.0% $1230,500 100.0% Vertical Analysis: Current liabilities $210,000 Total assets $1,139,500 = 18.4%
Lincoln CompanyComparative Balance Sheets December 31, 2003 December 31, 2002 Amount Percent Amount Percent Common-Size Statements Assets Current assets $ 550,000 48.3% $ 533,000 43.3% Long-term investments 95,000 8.3 177,500 14.4 Fixed assets (net) 444,500 39.0 470,000 38.2 Intangible assets 50,000 4.4 50,000 4.1 $1,139,500 100.0% $1,230,500 100.0% Liabilities Current liabilities $ 210,000 18.4% $ 243,000 19.7% Long-term liabilities 100,000 8.8 200,000 16.3 $310,000 27.2% $ 443,000 36.0% Stockholders’ Equity Preferred stock, $100 par $ 150,000 13.2% $ 150,000 12.2% Common stock, $10 par 500,000 43.9 500,000 40.6 Retained earnings 179,500 15.7 137,500 11.2 $829,500 72.8% $787,500 64.0% $1,139,500 100.0% $1230,500 100.0%
Solvency Analysis Solvency is the ability of a business to meet its financial obligations (debts) as they are due. Solvency analysis focuses on the ability of a business to pay or otherwise satisfy its currentandnoncurrent liabilities. This ability is normally assessed by examining balance sheetrelationships.
Solvency Measures — The Short-Term Creditor Working Capital and Current Ratio 2003 2002 Current assets $550,000 $533,000 Current liabilities 210,000 243,000 Working capital $340,000 $290,000 Current ratio 2.6 2.2 Divide current assets by current liabilities Use: To indicate the ability to meet currently maturing obligations.
Solvency Measures — The Short-Term Creditor Acid-Test Ratio 2003 2002 Quick assets: Cash $ 90,500 $ 64,700 Marketable securities 75,000 60,000 Accounts receivable (net) 115,000 120,000 Total $280,500 $244,700 Current liabilities $210,000 $243,000 Acid-test ratio 1.3 1.0 Use: To indicate instant debt-paying ability.
Solvency Measures — The Short-Term Creditor Accounts Receivable Turnover 2003 2002 Net sales on account $1,498,000 $1,200,000 Accounts receivable (net): Beginning of year $ 120,000 $ 140,000 End of year 115,500 120,000 Total $ 235,000 $ 260,000 Average $ 117,500 $ 130,000 Accts. receivable turnover 12.7 9.2 Use: To assess the efficiency in collecting receivables and in the management of credit.
Solvency Measures — The Short-Term Creditor Number of Days’ Sales in Receivables 2003 2002 Accounts receivable (net) end of year $ 115,000 $ 120,000 Net sales on account $1,498,000 $1,200,000 Average daily sales on on account (sales 365) $ 4,104 $ 3,288 Number of days’ sales in receivables 28 36.5 Use: To assess the efficiency in collecting receivables and in the management of credit.
Solvency Measures — The Short-Term Creditor Inventory Turnover 2003 2002 Cost of goods sold $1,043,000 $ 820,000 Inventories: Beginning of year $ 283,000 $ 311,000 End of year 264,000 283,000 Total $ 547,000 $ 594,000 Average $ 273,500 $ 297,000 Inventory turnover 3.8 2.8 Use: To assess the efficiency in the management of inventory.
Solvency Measures — The Short-Term Creditor Number of Days’ Sales in Inventory 2003 2002 Inventories, end of year $ 264,000 $283,000 Cost of goods sold $1,043,000 $820,000 Average daily cost of goods sold (COGS 365) $ 2,858 $ 2,247 Number of days’ sales in inventory 92.4 125.9 Use: To assess the efficiency in the management of inventory.
Solvency Measures — The Long-Term Creditor Ratio of Fixed Assets to Long-Term Liabilities 2003 2002 Fixed assets (net) $444,500 $470,000 Long-term liabilities $100,000 $200,000 Ratio of fixed assets to long-term liabilities 4.4 2.4 Use: To indicate the margin of safety to long-term creditors.
Solvency Measures — The Long-Term Creditor Ratio of Liabilities to Stockholders’ Equity 2003 2002 Total liabilities $310,000 $443,000 Total stockholders’ equity $829,500 $787,500 Ratio of liabilities to stockholders’ equity 0.37 0.56 Use: To indicate the margin of safety to creditors.
Solvency Measures — The Long-Term Creditor Number of Times Interest Charges Earned 2003 2002 Income before income tax $ 900,000 $ 800,000 Add interest expense 300,000 250,000 Amount available for interest $1,200,000 $1,050,000 Number of times earned 4.0 4.2 Use: To assess the risk to debtholders in terms of number of times interest charges were earned.
Profitability Analysis Profitability is the ability of an entity to earn profits. This ability to earn profits depends on the effectiveness and efficiency of operationsas well as resources available. Profitability analysisfocuses primarily on the relationship between operating results reported in the income statementand resources reported in the balance sheet.
Profitability Measures — The Common Stockholder Ratio of Net Sales to Assets 2003 2002 Net sales $1,498,000 $1,200,000 Total assets: Beginning of year $1,053,000 $1,010,000 End of year 1,044,500 1,053,000 Total $2,097,500 $2,063,000 Average $1,048,750 $1,031,500 Excludes long-term investments
Profitability Measures — The Common Stockholder Ratio of Net Sales to Assets 2003 2002 Net sales on account $1,498,000 $1,200,000 Total assets: Beginning of year $1,053,000 $1,010,000 End of year 1,044,500 1,053,000 Total $2,097,500 $2,063,000 Average $1,048,750 $1,031,500 Ratio of net sales to assets 1.4 1.2 Use: To assess the effectiveness of the use of assets.
Profitability Measures — The Common Stockholder Rate Earned on Total Assets 2003 2002 Net income $ 91,000 $ 76,500 Plus interest expense 6,000 12,000 Total $ 97,000 $ 88,500 Total assets: Beginning of year $1,230,500 $1,187,500 End of year 1,139,500 1,230,500 Total $2,370,000 $2,418,000 Average $1,185,000 $1,209,000 Rate earned on total assets 8.2% 7.3% Use: To assess the profitability of the assets.
Profitability Measures — The Common Stockholder Rate Earned on Stockholders’ Equity 2003 2002 Net income $ 91,000 $ 76,500 Stockholders’ equity: Beginning of year $ 787,500 $ 750,000 End of year 829,500 787,500 Total $1,617,000 $1,537,500 Average $ 808,500 $ 768,750 Rate earned on equity 11.3% 10.0% Use: To assess the profitability of the investment by stockholders.
Profitability Measures — The Common Stockholder Rate Earned on Common Stockholders’ Equity 2003 2002 Net income $ 91,000 $ 76,500 Less preferred dividends 9,000 9,000 Remainder—common stock $ 82,000 $ 67,500 Common stockholders’ equity: Beginning of year $ 637,500 $ 600,000 End of year 679,500 637,500 Total $1,317,000 $1,237,500 Average $ 658,500 $ 618,750 Rate earned on common equity 12.5% 10.9% Use: To assess the profitability of the investment by common stockholders.
Profitability Measures — The Common Stockholder Earnings Per Share on Common Stock 2003 2002 Net income $ 91,000 $ 76,500 Less preferred dividends 9,000 9,000 Remainder—common stock $ 82,000 $ 67,500 Shares of common stock 50,000 50,000 Earnings per share on common $1.64 $1.35 Use: To assess the profitability of the investment by common stockholders.
Profitability Measures — The Common Stockholder Price-Earnings Ratio 2003 2002 Market price per share of common $41.00 $27.00 Earnings per share on common $ 1.64 $ 1.35 Price-earnings ratio on common 25 20 Use: To indicate future earnings prospects, based on the relationship between market value of common stock and earnings.
Profitability Measures — The Common Stockholder Dividend Yield 2003 2002 Dividends per share of common $ 0.80 $ 0.60 Market price per share of common $41.00 $27.00 Dividend yield on common stock 1.95% 2.22% Use: To indicate the rate of return to common stockholders in terms of dividends.
Corporate Annual Reports In addition to financial statements, the annual reportincludes: 1. Financial Highlights 2. President’s Letter to the Stockholders 3. Management Report 4. Independent Auditors’ Report • Historical Summary
HOME WORK READING: • Illustrative problem • Self- examination questions • Multiple choice Writing: • Exercise: • Problem : 16-4B Discussion: