Download
1 / 47
470 likes | 565 Views
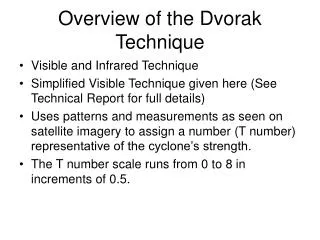
Explore how observing techniques impact radar data quality, spectral analysis, and receiver system functionalities. Learn about timing accuracy, signal processing, and EISCAT radar operations.

E N D
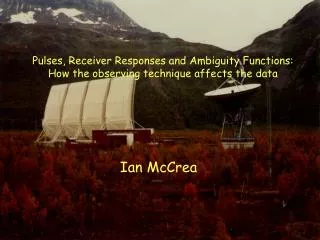
Pulses, Receiver Responses and Ambiguity Functions: How the observing technique affects the data Ian McCrea
A generic radar system Radar target: Physics Engineering Receiving antenna: Ar Transmitting antenna: GT Power: P To computer TX RX A/D Signal generator Timing & Control
What Happens in the EISCAT Receivers? We are measuring random plasma wave fluctuations in the ionosphere. Because the fluctuations are stochastic, two identical radars measuring different scattering volumes with identical ionospheric parameters would NOT make the same measurements at any given instant. Although the fluctuations measured by the two radars are stochastic, their expectation values are the same. Thus when we integrate over a sufficient period, we begin to obtain the same results. If we want to measure the spectral shape, we could make analogue measurements with a filter bank. The first IS radars actually worked this way ! However, since we know that the frequency spectrum can be Fourier transformed into an autocorrelation function (and vice versa), we can do the same thing by making digital measurements in the time domain and using them to calculate the autocorrelation function (ACF). To calculate the autocorrelation function, we need to take digitised samples of the received signal, spaced in time.
Timing microscale: Range and range resolution If we require a range inaccuracy < r, the TX/RX timing must be accurate to t 2 r/c Example: r = 30 m t 2 10-7 = 200 ns Range R = ct h0h0 =c ttx time 0 ttx t(h0)= h0/c + ttx/2 RX A sample taken at t = 2 h0/c + ttx contains contributions from the range (h0-h0/4.......h0 +h0/4), i.e. the range resolution is = c ttx/2
The Radar Controller • The ”heart” of the EISCAT radar systems • Controls all functions that require microscale (sub-microsecond) timing precision: • TX waveform generation and amplification • Antenna selection (at ESR) • TX/RX switching • Noise injection (for calibration) • RX frequency hopping • RX sample stream gating • various RX housekeeping functions • data dumping to crate computer • Basically a big, wide RAM bank, clocked at 10 GPS-MHz (100 ns) • One or more RAM bits assigned to every critical function
EROS and macroscale timing • EROS is a tcl/tk software application running on the main process computer at each site. • In addition to providing the run-time user interface, EROS handles all ”slow” (> seconds) timing in the system: • loads and configures microscale-timing HW, • schedules, starts, stops and changes experiments, • controls antenna pointing, • controls the polarisers and delays the R/C master clocks as required (only at the remote UHF sites) • More about EROS if you go on campaign...
Antenna Feed and Receiver Front End: Polariser, Receiver Protector, Noise Injection and Preamplifier • The POLARISER converts the high power TE10 WG mode into a RHC mode that is radiated by the antenna. On receive, the LHC polarised scatter signal is converted into a TE10 mode that leaves the polariser through its other port and enters the • RECEIVER PROTECTOR (RXP), which is a R/C controlled switch that isolates the receiver from the transmitter by more than -90 dB when the transmitter pulses. In the receive state it is almost transparent (loss -0.2 dB). The received signal next passes through a • NOISE INJECTION coupler. Noise can be injected on command from the R/C for calibration purposes. Finally, the scatter signal enters the • PREAMPLIFIER, a low-noise GaAsFET or HEMT amplifier that raises the signal level by 35 dB before sending it on to the first mixer unit.
930 MHz • Mix down to 120 MHz in the • hub room. First Local Oscillator The signal can then travel from the antenna to the control room without wave-guide losses. 120 MHz 2. Mix each channel separately down to an intermediate frequency of 30 MHz. Second Local Oscillator 3. Mix to zero, using a 30 MHz reference signal, with phase and quadrature detection. 30 MHz Complex Mix 0 The received signal is mixed down to zero in three stages.
How the receiver processes the signal First mixer ANALOG Second mixer A/D conversion Conversion to baseband DIGITAL Low-pass filtering and decimation
UHF Receiver Chain Analogue Part
UHF Receiver Chain Digital Part
Remote UHF RX Front End Note: To obtain optimum SNR, the polariser must be set to match the polarisation state of the received wave. As this is a function of the pointing geometry (which changes only when the antenna is moved – timing macroscale), the polariser control is included in the EROS antenna control software package. Polariser phase and amplitude offsets are site-specific and can vary over time – beware !
Effects of the Radar System on the Data Although we receive a signal at the antenna that comes from ionospheric incoherent scatter, by the time that signal gets sampled and digitised we have • amplified and/or attenuated it several times. • added thermal noise from the radar system. These processes change the signal by adding system noise. It is important to ensure that the system is as LINEAR as possible. A linear system has the following properties:
How Fast to Sample? Information theory tells us that the correct sampling frequency for a spectrum is at least twice the highest frequency contained in the spectrum. The EISCAT UHF frequency is about 928 MHz. Since the scattered ion line spectrum is less than 100 kHz wide, the highest returned frequency is ~ 928.05 MHz. This would imply a sampling frequency of order 2 GHz (one sample every 5 x 10⁻¹⁰ seconds). This is not possible ! However, by sampling every 5 x 10⁻¹⁰ seconds, we would measure all frequencies from zero to 1 GHz, whereas we only need to measure frequencies from 927.95 to 928.05 MHz!! This turns out to be very easy, provided we mix the signal frequency down first.
More things to worry about…….. • Even in the ideal case of a perfectly linear system, we still have to worry about: • The transmitter pulse shape (which affects what we can receive) • The method used to correlate the samples (which imposes numerical weightings) • The impulse response of the system (which imposes further time/range effects on our measured data)
Δf 0 What kind of filters to choose ? We need to choose a filter which: • Lets the whole scattered spectrum through without any attenuation • Allows for a Doppler shift in the spectrum due to high plasma velocities • Allows the extra bandwidth imposed by the transmitter pulse modulation to pass through the filter. How wide is the spectrum ? If the speed of the ion-acoustic wave is Then the Doppler shift is given by For an ion mass of 16 amu (oxygen) and Ti of 2000K, f ~ 9 kHz Note that this is the spectral HALF-WIDTH!
How big can the Doppler shift get ? Assuming a 100 mV/m E-field, giving a 2000m/s drift So it may be necessary to consider a 12 kHz wide spectrum that has been shifted by 12 kHz. This explains why it might be necessary to use filters with a half-width of 25 kHz.
What about the modulation bandwidth? If our transmitted signal is modulated by pulsing (which it has to be to get any range information) then the output of our quadrature detector is also modulated by the same pulse. For a stochastic signal y(t) of bandwidth y, modulated by a pulse of length T, the bandwidth of the modified signal becomes So now we need a filter that is not just wider than y, but needs to be wider than x as well. For long pulses, this turns out not to be too demanding, but for short pulse codes, the modulation bandwidth is much wider than the ion line spectrum.
Pulse Length (μs) Modulation BW (kHz) Potential Use 2.0 250.0 Alt. Code (D/E region) 4.0 125.0 Alt Code (D/E region) 10.0 50.0 Alternating or Barker Code 100.0 5.0 Long Pulse (low F region) 300.0 1.7 Long Pulse (F region) One might think that ideally the filter width should only be just as wide as needed. Making the filter wider would allow through unnecessary noise. However, this is not necessarily a problem, provided it doesn’t affect the signal to noise ratio in the target bandwidth. Even in the most linear system, what we end up with is not just the incoherent scatter signal. Our signal is deformed by the impulse response of the system, and at some time we’ll have to remove those effects.
Impulse Response Functions Since we have to pass our signal through filters and other hardware, we should be aware that all this electronics has some associated impulse response. The impulse response of a system is defined as the output signal arising from a delta-function input. The resultant measurement is a convolution of the original signal x(t) and the impulse response of the system h(t), written as (x*h)(t). If two functions are convolved, then their Fourier transforms are multiplied and we will see that we can use this fact to correct for the effect of the impulse response, provided it is known.
Impulse Responses for Real Filters in the (old) EISCAT System
Effects of the transmitted pulse The pulse shape that we use has an effect similar to that of the impulse response function The power spectrum FI(f) of the received ionospheric signal is convolved with that of the modulating pulse FT(f) Fs(f) = FI(f)*FT(f) which means that their autocorrelation functions are multiplied As(t) = AI(t).AT(t) Since the pulse shape is known, the effect can again be removed prior to analysis.
Ambiguity Functions • Ambiguity functions can be mathematically complex, but are conceptually simple: • Because we use finite length pulses, all of our received signals are inherently spread out in range • The ionospheric signal is further modified by the impulse response function of the radar system . • Ambiguities in range and time are two sides of the same coin ! • We define ambiguity mathematically in terms of the two-dimensional ambiguity function (which has dimensions of range and lag) • Provided that we know the ambiguity functions associated with any transmission and reception, we can reconstruct the original ionospheric signal.
Range R ½cτ τ Time Where (in the ionosphere) do data come from? For a monostatic radar system. At time t0, we begin to transmit a pulse of length τ. At time t1, such that t1>t0+ τ+tr, where tr is the receiver recovery time, it is safe for us to begin to sample. We can represent this situation with a RANGE-TIME DIAGRAM The first sample contains signal from the leading edge of the pulse at range R Suppose we now take a second sample at time t2 The range spread is still ½cτ, but the nominal range has moved out by c(t2-t1)/2 and from the trailing edge at range R- ½cτ, and all ranges in between. t0 t2 t1
Range R over a time, τ, signal is received from ranges (R- ½cτ) to (R+ ½cτ) ½cτ τ τ Time Where (in the ionosphere) do data come from? Suppose we want to probe the range R with a series of samples We would take our first sample when the leading edge of the pulse was at range R, and the last sample when the trailing edge of the pulse was at R. In between these times, we make a series of closely-separated samples t0
½cτ ½cτ Where (in the ionosphere) do data come from? We then use these samples to calculate the various lags of the ACF. The correlator performs cross-correlations and combines all examples of a given lag. Returns can be correlated only when there is spatial overlap between samples. Contributions to ‘lag 1’ come from almost the whole scattering volume. Contributions to ‘lag 5’ come only from the mean range, R. Range R Time
½cτ ½cτ Where (in the ionosphere) do data come from? The previous example was somewhat extreme: For real F-region sounding, we might use a long pulse of ~300 us, and a sampling interval of 10 us, so the number of available lags would be ~30 Note that the choice of pulse length and sampling interval are dictated by altitude variation of the target ionosphere and the ion line (or modulation) bandwidth. Range R Time
Creating the Autocorrelation Function Let’s assume that we have two streams of samples, from the two outputs of the hybrid detector. • From the in-phase output we have X1, X2, X3, X4 … and so on. • From the quadrature output we have Y1, Y2, Y3, Y4 … and so on. • From these, we can calculate the different lags of the real and imaginary parts of the autocorrelation function as follows: R(i,j) = (XiXj + YiYj) I(i,j) = (XiYj – XjYi) If i=j, then we are calculating lag 0. If |i-j| =1, then we are calculating lag 1, |i-j| = 2 is lag 2 and so on … We often refer to these computations as CROSS PRODUCTS or LAG PRODUCTS of the ith and jth samples, written as sisj*. Although each sample is used many times, data from a stochastic process only makes sense when integrated over a relatively long time. The data are therefore heavily post-integrated and each individual cross-product does not need to be stored (although storing the variances does help in error-analysis).
Zero-Lag Profiles (“Power Profiles”) If we take every sample pair (xi and yi for I=1:n) and use them to compute n estimates of the zero lag, this generates the zero lag profile. Remember, because this is a stochastic process, multiple estimates of the zero lag profile have to be added before the sum approaches the expectation value and the measurement becomes meaningful. The zero lag is an estimator of the received POWER. Hence we have a measure of power as a function of range. Although this estimate contains no information about spectral shape (and hence temperature, velocity etc) we can use it to calculate RAW ELECTRON DENSITY. This first estimate is spread in range. At first, a shorter pulse might seem better, since this would minimise the range ambiguity, but it isn’t. (Remember the radar equation).
Range lag 1 lag 3 lag 5 Time Non-Zero Lags: Spatial Weightings To calculate non-zero lags, what we are doing is: To form lag 1 for example, we have to form the cross product of two adjacent samples. What effect does this have on the correlation? The range spreads of the two samples are not the same (because the signal has moved on in range by cδt/2 between the times at which the samples were made. As we increase the spacing between samples, the correlated volume shrinks until it comes from the centre of the volume. This is bad, because there is less correlated signal in the data and so longer integration times are needed to form the expectation value. It follows that there is no point calculating a lag longer than the pulse length since the correlated volume will have shrunk to zero.
Non-Zero Lags: Numerical Weightings In this simplified scheme, it’s not only the spatial weighting that is a function of lag number. Imagine we had a 300 s pulse. If we are sampling at 10 s intervals, we can use a sample together with 29 subsequent samples to form our ACF, without completely losing our spatial correlation. From our group of 30 samples, s1 to s30, we have 30 potential estimates of zero lag; s1s1*, s2s2*, s3s3*, s4s4*, ……….s29s29*, s30s30* However there are only 29 ways of making lag 1 s1s2*, s2s3*, s3s4*, s4s5*, ……….s29s30* and there is only one way of making lag 29; s1s30* In addition to the spatial weighting, there is also a numerical weighting factor that we need to consider. Both of these conspire to make the longer lags very ill-determined. Considering how primitive this scheme is, it’s surprising that this technique – sometimes called pre-gating - was used at EISCAT for many years!
How can we do better? Let’s consider lag 29 again. We can see that it can be formed using the cross-product s1s30* but it can also be formed by s2s31*, s3s32* etc. Although the area of spatial correlation between these samples is still small and different every time, each of these small correlated volumes is still a subset of the correlated volume for lag 0, lag 1 etc. If we consider the whole series of samples that we take, without restricting ourselves to groups of 30, then we could arrange the cross-products which we use to calculate the various lags of the ACF in such a way as to make the numerical and spatial weightings approximately even as a function of lag. The price we pay is that adjacent gates are not independent! This flexible way of handling cross-products and re-using the same samples many times, was first introduced in the GEN correlator algorithms in the early 1990s.
The Lag Profile Matrix The lag profile matrix is essentially a matrix of sample cross-products. If the x and y axes are defined by samples 1 to n, then the leading diagonal consists of the cross-products sisj* where i=j. In other words, the leading diagonal represents the zero lag profile and the axis running parallel to this diagonal represents increasing range. In the same way, the next diagonal is sisi+1*, i.e. it is the range profile of lag 1. In reality of course the matrix is much bigger than 9x9 samples. Suppose we sample the pulse at 10 us intervals between heights of 170 and 900 km. The time taken for the pulse to propagate through the ionosphere is about half a millisecond, and the number of samples per pulse is: If we were to post-integrate the correlated data at a resolution of 5 seconds (which is typical) then we are effectively adding around 10,000 of these lag profile matrices together, which turns out to be much more than adequate to form the expectation value.
A pre-gated ACF, made from a closed set of samples, has a triangular weighting function like this: The GEN-type correlation schemes, which use an increasing number of samples to determine the longer lags in order to achieve more even spatial and numerical weightings have functions like this: Gating Strategies We can now think of how to form “range gates” from our lag profile matrices. Within a range gate, the simplest assumption is that our lag profile is constant, so we can average all the cross-products together into a single estimate. In GEN-type schemes, different numbers of samples are used in the calculation of every lag. The number of samples used to calculate the zero lag is sometimes called the VOLUME INDEX. Both of these approaches have the property that different lags come from different spreads of ranges. This concept is defined mathematically by the RANGE AMBIGUITY FUNCTION.
Range Ambiguity Function A knowledge of the range ambiguity is essential when working with any kind of radar data, and indeed it is the requirement for certain levels of range ambiguity which drives the pulse coding techniques which we’ll see later on. Range Ambiguity arises because: a) All the sounding pulses we use have a finite length (and thus occupy a finite volume of ionosphere). b) The receiver systems we use have finite (i.e. not function) impulse responses, so that the system’s response to an input signal is also smeared in time (range). Let’s assume that the spectral shape (or ACF shape) is constant throughout the range over which our gate is calculated. In this case, range ambiguity is the only ambiguity which we need to worry about. It turns out that the range ambiguity function is given by the convolution of the modulation envelope with the receiver’s impulse response. Note that the range ambiguity is lag-dependent.
e.g. for the lag t-t| where p is the impulse response and S is the travel time of the signal (2r/c). Note that the ambiguity function must vanish if there is no longer any spatial correlation between the samples, so the range ambiguity function for different lags of a long pulse with old-style pre-gating looks like this: What’s happening here is that p*env is shifted by the range delay of the lag. Then the shifted p*env is multiplied by the unshifted one. The products are the shaded regions, which are the regions where the spatial correlation doesn’t vanish to zero.
½cτ ½cτ Where (in the ionosphere) do data come from? We then use these samples to calculate the various lags of the ACF. The correlator performs cross-correlations and combines all examples of a given lag. Returns can be correlated only when there is spatial overlap between samples. Contributions to ‘lag 1’ come from almost the whole scattering volume. Contributions to ‘lag 5’ come only from the mean range, R. Range R Time
Some range ambiguity fuctions for a real experiment The pictured range ambiguity functions are for the CP1K experiment, where we use the GEN-type approach, including additional samples in the calculation of the longer lags. For the long pulse, the pulse length is 350 us, the impulse response is that of a 50 kHz Butterworth filter, sampling is done at 10 us intervals and lags are calculated every 10 us to a length of 250 us. The volume index is 15. Note that all the range ambiguity functions are now approximately the same length, though the detailed shapes are different. Note how long these ambiguities are: 500 s = (500 x 10-6 x 3 x 108 x 10-3 )/2 = 75 km. This kind of long pulse might be acceptable for probing the F-region, but not for the E-region as the ionosphere will change significantly within the pulse length, and the range ambiguity will “smear” these variations.
Lag Ambiguity Functions Range ambiguities are not the only ones we have to worry about. So far we’ve assumed that all our samples are taken in an infinitely short time, and a cross-product of two samples gives the value of the acf at precisely that lag. In fact this is not the case either. We also have to worry about the lag ambiguity function, which is given by the product of the autocorrelation functions of the modulation envelope and the impulse response: What this means is that ambiguity functions are two-dimensional, having finite width in both range and lag. In other words, every cross-product we compute is not a precise point measurement. Rather it is a measurement distributed over a finite range and a finite time. For this reason, the full ambiguity function is often called the TWO-DIMENSIONAL AMBIGUITY FUNCTION, and the range and lag ambiguity functions are called ONE-DIMENSIONAL AMBIGUITY FUNCTIONS or REDUCED AMBIGUITY FUNCTIONS.
Two-dimensional ambiguity function for a power profile Two dimensional and reduced ambiguity functions for the 40 μs pulse of EISCAT CP1K-experiment. Zero lag of the two-dimensional ambiguity function of a single pulse
Where have we got to ? • We are beginning to understand that the ISR technique is not totally simple ! • The observations we make are substantially conditioned by the way that we make them. • The properties of the radar modify our data, and place some constraints on the kinds of observations we can carry out. • Next we will see that the physics of the ionosphere also imposes important constraints. • We’ll then try to synthesise all these constraints into some design considerations for real radar experiments.