Download
1 / 19
190 likes | 307 Views
Finding the right viewing window is crucial when graphing functions. This guide explores methods to determine the best settings for your graphing calculator. Start by entering your function, and using the basic ZOOM|ZStandard option. If the graph isn't satisfactory, adjustments will be necessary. Techniques like ZOOM|ZoomFit can quickly reframe the view, helping you visualize all features of your function. Learn how to manipulate the Xmin, Xmax, Ymin, and Ymax settings to optimize your graph's clarity and detail.

E N D
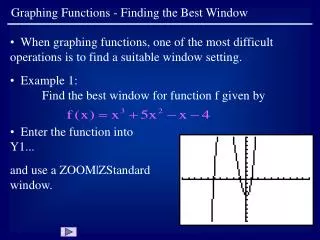
Example 1: Find the best window for function f given by Graphing Functions - Finding the Best Window • When graphing functions, one of the most difficult operations is to find a suitable window setting. • Enter the function into Y1... and use a ZOOM|ZStandard window.
Graphing Functions - Finding the Best Window • Note that part of the curve is not shown. Recall that the range for both x and y in ZOOM|ZStandard is from -10 to 10. • The range for y needs to be increased, say to +15. 10 -10 10 -10 • To make the adjustment, press WINDOW. • Use the down arrow to highlight “Ymax”. Slide 2
Graphing Functions - Finding the Best Window • It is not necessary to use the Delete key to erase the “10”. It will be automatically deleted as a new value is entered. • Type in 15 and press GRAPH. • Since the relative maximum is still not viewable, press WINDOW and change Ymax to 20, then press GRAPH. Slide 3
Graphing Functions - Finding the Best Window • Now we have a good viewing window for the graph. Note that the tic marks (each representing 1 unit) on the y-axis are closer together than those on the x-axis. • To see more of the relative maximum and relative minimum, change the window: • Press WINDOW. • Change the settings to ... • Press GRAPH. Slide 4
Example 2: Find the best window for function f given by Graphing Functions - Finding the Best Window • There are faster methods for finding a suitable window for some graphs. ZOOM|ZoomFit is used often for this purpose. • A different process will be used on this function, which is the same function as used in example 1. Enter the function into Y1, if it is not already there, and use a ZOOM|ZStandard window. Slide 5
Graphing Functions - Finding the Best Window • Rather than make changes in WINDOW, go to ZOOM|ZoomFit. Wait a few seconds as the calculator defines a new window and draws the graph. • An alternative to typing the zero for the menu item is to use the up-arrow after pressing ZOOM. This puts the selection cursor right on ZoomFit. Then press ENTER. Slide 6
Graphing Functions - Finding the Best Window • While this method was very quick, it did not produce the appropriate graph. With ZoomFit the calculator considers all x-values in the window setting (-10 to 10 currently), and finds the smallest and largest y-values on this domain. These y-values then take the place of Ymin and Ymax. • To see the current window settings, press WINDOW. Slide 7
Graphing Functions - Finding the Best Window • The y-values are clearly outside of the range of interest. • To correct this, first set the desired x-values in the window. Go back to the ZOOM|ZStandard window to determine what these values should be. • The basic shape of the graph is defined from around x = -6 to x = 2. Press WINDOW and enter the new values into Xmin and Xmax. Slide 8
Graphing Functions - Finding the Best Window • Now go back to ZOOM|ZoomFit. • This is now a good graph that shows the basic shape. The almost solid line on the y-axis means that too many tic marks are used. Press WINDOW. • The range in the y is 56 units (-34 to 22). Change the Y scale, or Yscl, to 5, so that the tic marks will be five units apart. Then press GRAPH. Slide 9
Graphing Functions - Finding the Best Window • It must be remembered that the tic marks on the x-axis represent one unit, while the tic marks on the y-axis represent 5 units. • The work in this example may have appeared to be long and unnecessary. With the current function, example 1 was in fact the easier method. As the next example shows though, ZoomFit is an important method to know. Slide 10
Graphing Functions - Finding the Best Window • Example 3: An object is thrown directly upward from the top of a 100 ft. tower, with an initial velocity of 40 ft/sec. Use a graph to find the maximum height the object achieves. • The equation for the height s at a given time t is given by: • Enter the function into Y1. Slide 11
Graphing Functions - Finding the Best Window • Note that the change in variable from t to x will not change the look of the graph. • Use a ZOOM|ZStandard window. • Clearly, the graph is not very helpful. Since t = time should not be negative in this case, and it takes only a few seconds for the object to fall to the ground, do the following: Slide 12
This is a good graph that represents the actual situation. Remember that the graph shown is not the path of the object, but a graph whose ordered pairs (t,s) represent a height s ft. at time t sec. Graphing Functions - Finding the Best Window • Press WINDOW, change Xmin to 0 and Xmax to 5. • Go to ZOOM|ZoomFit. Slide 13
Press WINDOW, and change (1) Ymin to -10, since height won’t be negative, but it is good to see the x-axis. (2) Ymax to 150, since it is better to not have the relative maximum at the very top of the screen. (3) Yscl to 10. Graphing Functions - Finding the Best Window • Touch up the graph by making the following changes: • Press GRAPH. Slide 14
Graphing Functions - Finding the Best Window • Now the original problem can be solved, find the maximum height of the object. • Go to CALC|maximum ... and find the relative maximum to be 125 feet at 1.25 seconds. • Note that ZOOM|ZoomFit made the process rather easy. Slide 15
Graphing Functions - Finding the Best Window • A third way to find a suitable window is to use the TABLE function. • Example 4: Sketch the graph of the following function: • Enter the function into Y1 and use a ZOOM|ZStandard window. Slide 16
Graphing Functions - Finding the Best Window • Go to TBLSET and make the following changes: (1) TblStart = -5 (2) Tbl = 1 (3) Both Indpnt and Depend at Auto • Go to TABLE. Slide 17
Graphing Functions - Finding the Best Window • From the table, -290 is the smallest y-value. It is possible that there could be a smaller value at say -0.5, but a Ymin of -300 should be close. • Press WINDOW, and make the following changes: • Press GRAPH. • TABLE can be very useful in finding an appropriate window for graphs. Slide 18