Download
1 / 16
160 likes | 198 Views
Learn to plot vertical/horizontal/slant asymptotes, x & y intercepts of rational functions, sketching curves with examples.

E N D
Creating the graph • Put a vertical asymptote through the non-removable zeros of the denominator. (note: removable discontinuities get covered in calculus) • Plot any horizontal or slant asymptotes. • Plot as many points as needed between and beyond asymptotes to determine the shape of the graph. • Sketch the curve.
Plotting points beyond and between asymptotes • It will work to pick any number you want between and beyond asymptotes. A superior student will include the x and y intercepts • x intercepts occur where y=0. For rational expressions this is where the numerator equals zero. • y intercepts occur where x = 0. Just plug in a zero.
Plot any vertical asymptotes • Remember that division by zero is not allowed. • Put a vertical asymptote through any number that makes the denominator (bottom) zero. You can think of it as a fence that says “Don’t go here.” • Advanced: If a factor in the denominator can be canceled, it’s called a “removable discontinuity.” You mark it with a hole in the graph rather than an asymptote.
Plot any horizontal or slant asymptotes • Compare the degrees of the numerator (n) and the denominator (m). • If n < m, you have the x-axis for a horizontal asymptote. • If n = m, you have a horizontal asymptote that is a fraction of the leading coefficients. • If n = m + 1, then you use long division to find the slant asymptote.
Example 1, step 1 Put a vertical asymptote through the zeros of the denominator. In this example, the denominator is zero when x = -1
Example 1, step 2 n = 0 m = 1 Compare the degrees of the numerator and denominator. Use the chart to decide which type of asymptote (if any) you have. Since the degree in the numerator is smaller, the graph has a horizontal asymptote on the x-axis
Example 1, step 3 Plot as many additional points as needed to determine the shape of the graph. We need one point to either side of x = -1 to decide which way the graph will go. Let’s use x = 0 and -2
Example 1, step 4 Now we sketch the curve.
Example 2 1. Find the vertical asymptote. 2. Find the slant/horizontal asymptote 3. Find the intercepts. (0, -4) and (-3, 0) 4. Find a point on the right side x =2 gives y = 20 which is off the graph but tells us which way it goes 5. Sketch the curve
Example 3 1. Graph the vertical asymptote x = 2
Example 3 continued 2. Since the degree in the numerator is 1 higher than the degree in the bottom (n = m + 1), we use long division to find a slant asymptote. The top will always be a y = mx + b equation. Discard the remainder.
Example 3 continued 3. Find the x and y intercepts. You will need to factor the numerator to find the x-intercepts. (0, 10), (-5, 0), (4, 0) 4. Draw
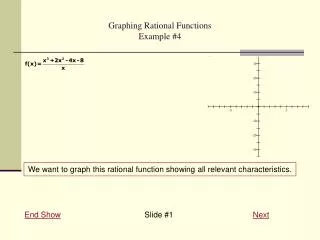
Example 4 1. Find the vertical asymptotes. 2. Find the horizontal/slant asymptote 3. Find the intercepts. 4. Plot extra points to determine the shape of the graph. You will need one on each side of the asymptotes as well as between the asymptotes and intercepts. Choose x = 1, -1, 3, -3 5. Sketch.
Example 5 (last one) 1. Find the vertical asymptotes. 2. Find the horizontal/slant asymptotes. 3. Plot your intercepts. 4. Plot as many extra points as needed between and beyond asymptotes. Choose x = 1, -1, 4, and -4 5. Sketch.