Download
1 / 1
10 likes | 109 Views
This paper presents statistical methods for correcting daily precipitation data from climate models, focusing on reducing the high number of precipitation days and achieving a realistic distribution. Methods include L1 and L2 transformations, with application examples using observed data and a regional climate model. Results show improved accuracy with both methods. For more details and comparisons with nonlinear methods, refer to Hnilica J., Pus V. (2012).

E N D
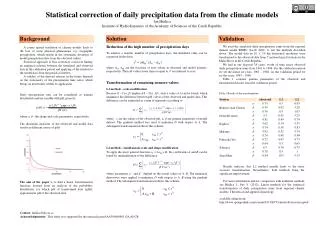
Statistical correction of daily precipitation data from the climate models Jan Hnilica Institute of Hydrodynamics of the Academy of Sciences of the Czech Republic Background Validation Solution Reduction of the high number of precipitation days To achieve a realistic number of precipitation days, the threshold value can be expressed in the form where ΔO, ΔMare the fractions of zero values in observed and model datasets, respectively. Then all values lower than or equal tox0 are reduced to zero. Transformation of remaining nonzero values L1 method – scale modification Because X ~ Γ(α, β) implies AX ~ Γ(α, Aβ), such a value of A can be found,which minimizesthe difference between pdfcurves of the observed and modet data. This difference can be expressed as a sum of segments according to where yi are the values of the observed pdf, α, β are gamma parameters of model dataset.The gradientmethod was used to minimize D with respect to A.The subsequent transformation follows this scheme L2 method – simultaneous scale and shape modification To apply the more general function xT = AxM + B, the coefficientsA andB can be found by minimalizationof the difference where parameters α´and β´ depend on the actual values of A, B. The numerical derivatives were applied to minimize Dwith respectto A, B using the gradientmethod.The subsequent transformation follows this scheme We used the simulated daily precipitation sums from the regional climate model REMO (Jacob 2001) to test the methods described above. The model data in 10 × 10 km horizontal resolution were transformed to the observed data from 7 meteorological stations in the Malse River in the Czech Republic. We had at our disposal 38 years’ worth of time series observed daily precipitation sums from 1961 to 1998. For the calibration period we set the initial six years, 1961 – 1966. As the validation period we set the years, 1993 – 1998. Table 1 contains gamma parameters of the observed and transformed datasets from the validation period. Table 1 Results of the transformation A coarse spatial resolution of climate models leads to the loss of some physical phenomena, e.g. orographic precipitation, which results in the systematic deviation of model precipitation data from the observed values. Statistical approach to bias correction consist infinding an empirical relation between the simulated and observed data in the calibration period and applying of the relation to the model data from the period of interest. A validity of the derived relation in the future depends on the stationarity of the precipitation time series which brings an uncertainty within its application. Daily precipitation sum can be considered as gamma distributed random variable with pdf given by where α, β - the shape and scale parameters, respectively The dissimilar character of the observed and model data results in different course of pdfs: The aim of the paper is to find a linear transformation function, derived from an analysis of the probability distribution, for which pdf of transformed data tightly approximates pdfof the observed data. Results indicate, that L2 method usually leads to the more accurate transformation. Nevertheless, both methods bring the significant improvement. For more information and for comparison with nonlinear methods seeHnilica J., Pus V. (2012): Linear methods for the statistical transformation of daily precipitation sums from regional climate models. Theoretical and applied climatology. available online from: http://www.springerlink.com/content/101580/?Content+Status=Accepted Contact: hnilica@ih.cas.cz Acknowledgements:This study was supported by the research grant IAA300600901 GA AS CR