Download
1 / 19
190 likes | 262 Views
Explore the intricate nature of business location decisions, from geographical configurations to cost-service tradeoffs. Learn about dimensional analysis models, break-even analysis, market area determination, LP models, and more.

E N D
Business Location Decisions Dr. Everette S. Gardner, Jr.
Complexity of the location problem • If there are N potential facility sites, there are (2^N) – 1 different geographical configurations. • Example: 4 potential sites (A,B,C,D) (2^4) – 1 = 15 Number of Number of facilities used Alternatives Alternatives 1 A,B,C,D 4 2 AB, AC, AD, BC, 6 BC, CD 3 BC, ABD, ACD, 4 BCD 4 ABCD 1 15 Business Location
Complexity of the location problem (cont.) ● Number of Number of alternative potential sites geographical configurations 5 31 10 1,023 20 1,048,575 50 > 10^5 100 > 10^30 Business Location
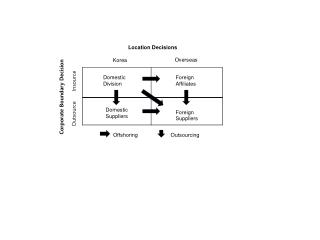
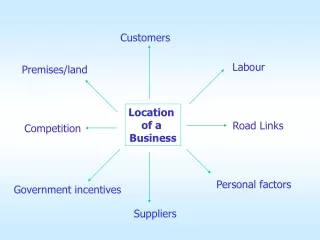
100% Customer service level (%) Total distribution costs Transportation costs 0 0 Number of warehouses Cost-service tradeoffs in logistics planning Customer service axis: % of demand filled within given time frame Dollar cost axis Inventory costs Fixed facility costs Business Location
Analog model for facility location Business Location Center.xls
Dimensional analysis in location decisions • Location decisions are based on two types of information: Tangibles (objective or quantitative) Intangibles (subjective) • Dimensional analysis helps: Measure and evaluate intangibles Combine tangible and intangible measurements into an overall value index for each location Business Location
Building a dimensional analysis model • List the decision factors • Score the decision factors: • Natural units for tangible factors (usually financial) • Subjective scores for intangibles, scale of 1 to 10 1 represents the ideal 10 represents a disaster • Weight each decision factor (scale of 1 to 5) • Compute weighted ratios (Score for option A / Score for option B)^Weight • Compute preference number Product of weighted ratios Business Location Dimensional.xls
Basic calculations in dimensional analysis: U.S. Air vs. Alaska airlines Business Location
Break-even analysis • Break-even Total fixed costs point = Unit Variable cost in units price per unit Example: FC = $25,000, P = $20, VC = $10 BE = $25,000 = 2,500 units 20 – 10 Business Location
Break-even analysis (cont.) $ Sales revenue Profit 1000 2000 3000 4000 5000 Units of output Total costs Break- even point Variable costs Fixed costs Losses Business Location
Determining market areas • “Laid down costs” are the delivered costs of a product. LDC = P + RX Where P = Production cost/unit R = Transportation rate X = Distance Business Location
Determining market areas (cont.) • Market boundaries are at points where lines of equal LDC intersect: x C $2 $4 $6 N A $8 y $2 $4 $6 B $8 $2 z $4 $6 Business Location
LP models for location decisions • Simple transportation model Sources Destinations Business Location
LP models for location decisions (cont.) • Transshipment model Sources Transshipment Destinations points • Both models can be used to plan shipments over multiple time periods Business Location
Preliminary steps in locating service outlets • Group population into geographic areas (usually use census blocks) 2.Use demographic data to determine probable facility usage for each potential location • Choose objective function: A. Maximize utilization B. Minimize distance per capita C. Minimize distance per visit D. Minimize average reduction in number of visits made due to location decision E. Weighted measures Business Location
Y 20 Figure 7. A hypothetical medical service area with 32 census blocks and three cities. City populations are (approximately) A = 17,000, B = 9,000, and C = 13,000. Distances on x-y axes are in miles. 7 6 11 21 2 10 3 1 8 5 10 City A 22 15 4 9 23 13 12 10 26 20 -10 18 X 14 17 25 30 19 29 32 31 20 16 24 27 26 City B -10 City C Business Location
TABLE 12Location coordinates in miles for three criteriaand different numbers of centers* Criterion Center number (1) Maximize (2) Minimize distance (4) Minimize distance utilization per capita per encounter x y x y x y I With 1 center 1 21.00 -3.00 0.64 1.20 -8.70 10.10 II With 2 centers 1 21.4 -3.7 17.6 -3.30 18.50 -3.30 2 -9.89 10.4 9.89 10.4 -9.90 10.40 III With 3 centers 1 22.40 -3.1 21.52 -2.78 22.30 -3.20 2 -10.16 10.40 -10.20 10.40 -10.20 10.40 3 3.63 -2.75 3.60 -2.80 3.60 -2.80 * See figures 7 and 8 for locations of coordinates. ** Determined only for the first criterion. Business Location
TABLE 12Location coordinates in miles for three criteriaand different numbers of centers* (cont.) Criterion Center number (1) Maximize (2) Minimize distance (4) Minimize distance utilization per capita per encounter x y x y x y IV With 4 centers 1 22.40 -3.14 22.00 -3.50 21.23 -3.08 2 -10.20 10.40 -10.10 10.30 -9.80 10.40 3 3.59 -2.78 2.69 -4.80 3.61 - 2.70 4 11.32 -2.25 3.76 3.04 -11.35 3.00 V With 5 centers** 1 22.40 -3.10 2 -9.72 10.61 3 3.24 -3.19 4 -11.62 3.24 5 11.04 -2.00 * See figures 7 and 8 for locations of coordinates. ** Determined only for the first criterion. Business Location
3 15 City A Center Criterion governing center locations Figure 8. Location of one center based on three different criteria. 10 5 2 10 15 20 25 5 -5 -15 -10 -5 1 -10 City B City C Business Location