Download
1 / 39
390 likes | 511 Views
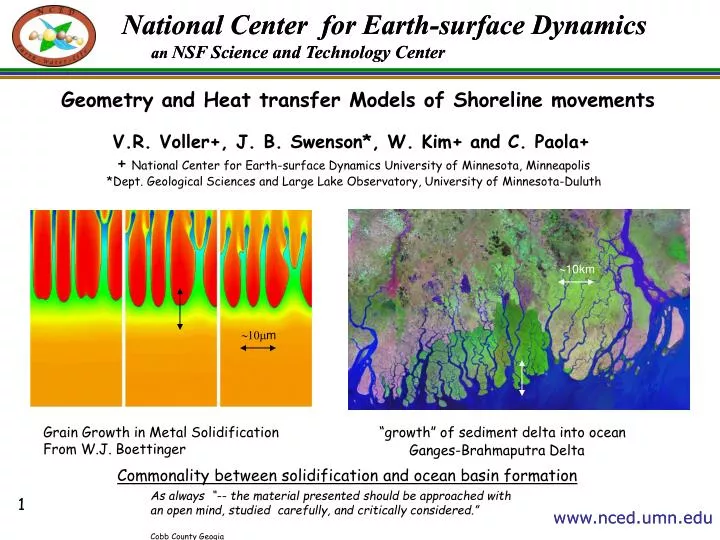
~10m m. Grain Growth in Metal Solidification From W.J. Boettinger. National Center for Earth-surface Dynamics an NSF Science and Technology Center. Geometry and Heat transfer Models of Shoreline movements. V.R. Voller+, J. B. Swenson*, W. Kim+ and C. Paola+

E N D
~10mm Grain Growth in Metal Solidification From W.J. Boettinger National Center for Earth-surface Dynamics an NSF Science and Technology Center Geometry and Heat transfer Models of Shoreline movements V.R. Voller+, J. B. Swenson*, W. Kim+ and C. Paola+ + National Center for Earth-surface Dynamics University of Minnesota, Minneapolis *Dept. Geological Sciences and Large Lake Observatory, University of Minnesota-Duluth ~10km “growth” of sediment delta into ocean Ganges-Brahmaputra Delta Commonality between solidification and ocean basin formation As always “-- the material presented should be approached with an open mind, studied carefully, and critically considered.” Cobb County Geogia 1 www.nced.umn.edu
Two Problems of Interest Shoreline Fans Toes
Examples of Sediment Fans Moving Boundary Badwater Deathvalley 1km How does sediment- basement interface evolve
land surface shoreline ocean x = u(t) x = s(t) a sediment h(x,t) bed-rock b x
Melting vs. Shoreline movement An Ocean Basin
Calculated front velocity from exp. measurment of RHS measured Experimental validation of shoreline boundary condition Flux balance at shoreline eXperimental EarthScape facility (XES) Flux base subsidence slope
Base level 1-D finite difference deforming grid vs. experiment (n calculated from 1st principles) Measured and Numerical results +Shoreline balance
A Melting Problem driven by a fixed flux with SPACE DEPENDENT Latent Heat L = gs Enthalpy Sol. Depth at toe Limit Conditions: A Fixed Slope Ocean q=1 h a b similarity solution s(t) g = 0.5
Enthalpy Sol. A 2-D Front -Limit of Cliff face Shorefront But Account of Subsidence and relative ocean level land surface shoreline ocean h(x,y,t) x = s(t) G(x,y,t) Solve on fixed grid in plan view bed-rock y Track Boundary by calculating in each cell x y
Hinged subsidence h h b s(t) s(t)
A 2-D problem Sediment input into an ocean with an evolving trench driven By hinged subsidence First look at case where Ocean is at constant depth NO TRENCH Then Look at case with Trench
Plan view movement of fronts Trench No Trench
Assumption of rapid fluvial transport allow for a geometric balance q=1 R s(t) s(t) u(t) NOTE: REVERSE of shoreline! geometric – model of shoreline movement with changing sea level shoreline sea-level
Dam reservoir profile With sediment plug downstream of dam Movement of sediment plug behind a dam At time t = 0 water level in reservoir dropped at a Constant rate sediment assume cliff face no flow in or out Describe movement of Sediment by Water depth
Experiments by Chris Bromley, University of Nottingham Ekwha dam Oregon
Movement of sediment plug behind a dam drawdown rate 0.0025 sediment 0.005 0.001 Movement of toe Goes as t2
Shoreline position is signature of channels The Po Models can predict stratigraphy “sand pockets” = OIL WHY Build a model
Enthalpy Sol. Shoreline Tracking Model has been Validated (Experiments) And a numerical method based on Heat Transfer concepts has been Verified. Space and time dependent latent heat Will allow for a first cut simulation of how sea-level and subsidence Could effect the motion of shorelines Can be used to model short time systems Related to dam removal Other Systems of interest
Badwater Deathvalley e.g. the Dessert Sediment Fan 1km How does sediment- basement interface evolve
An experiment • Water tight basin -First layer: gravel to allow easy drainage -Second layer: F110 sand with a slope ~4º. • Water and sand poured in corner plate • Sand type: Sil-Co-Sil at ~45 mm • Water feed rate: • ~460 cm3/min • Sediment feed rate: ~37cm3/min
The Desert Fan Problem A Stefan problem with zero Latent Heat
The Numerical Method -Explicit, Fixed Grid, Up wind Finite Difference VOF like scheme fill point The Toe Treatment r P E Square grid placed on basement .05 grid size Flux out of toe elements =0 Until Sediment height > Downstream basement At end of each time step Redistribution scheme is required To ensure that no “downstream” covered areas are higher Determine height at fill : Position of toe
y – y(x,t) = 0 On toe height at input fan with time