Having Fun with
Learn how Gantt and PERT charts aid in managing complex projects, organizing tasks and resources effectively, and identifying critical paths. Discover the basics and creation steps of Gantt charts and PERT charts to enhance project monitoring and progress tracking. 8 Relevant

Having Fun with
E N D
Presentation Transcript
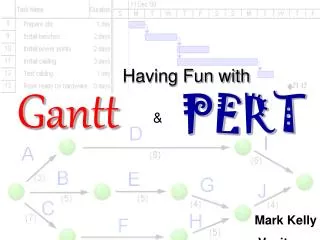
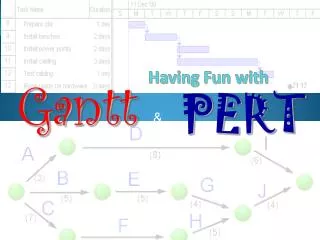
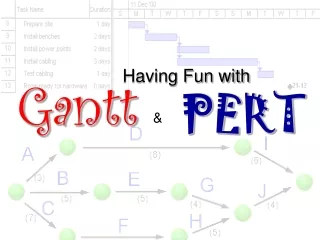
Having Fun with Gantt PERT &
What are they? Gantt and PERT charts are both “CPM” (Critical Path Method) tools to: • manage the tasks involved in big and complex projects • let project managers organise time, people, equipment and money • ensure the right people and equipment are in the right place and the right time • allow managers to monitor the progress of a project
Gantt Charts Gantt Charts Henry Laurence Gantt (1861-1919)
Gantt Basics • Basically, a timeline with tasks that can be connected to each other • Note the spelling! • It is not all-capitals! • Can be created with simple tools like Excel, but specialised tools like Microsoft Project make life easier
Making a Gantt chart • Step 1 – list the tasks in the project
Making a Gantt chart • Step 2 – add task durations
Making a Gantt chart • Step 3 – add dependencies (which tasks cannot start before another task finishes)
Notes • The arrows indicate dependencies. • Task 1 is a predecessor of task 2 – i.e. task 2 cannot start before task 1 ends. • Task 3 is dependent on task 2. Task 7 is dependent on two other tasks • Electrics, plumbing and landscaping are concurrent tasks and can happen at the same time, so they overlap on the chart. All 3 can start after task 4 ends. • Painting must wait for both electrics and plumbing to be finished. • Task 9 has zero duration, and is a milestone
Making a Gantt chart • Step 4 – find the critical path The critical path is the sequence of tasks from beginning to end that takes the longest time to complete. It is also the shortest possible time that the project can be finished in. Any task on the critical path is called a critical task. No critical task can have its duration changed without affecting the end date of the project.
MS Project can work out the critical path for you! • The length of the critical path is the sum of the lengths of all critical tasks (the red tasks 1,2,3,4,5,7) which is 2+3+1+1.5+2+1 = 10.5 days. • In other words, the minimum amount of time required to get all tasks completed is 10.5 days • The other tasks (6,8) can each run over-time before affecting the end date of the project
The amount of time a task can be extended before it affects other tasks is called slack (or float). • Task 6 can take an extra day and a half before it affects the project’s end date, so each has 1.5 day’s slack.
Critical tasks, by definition, can have NO slack. Tip: If ever asked Can task X’s duration be changed without affecting the end date of the project?, if it is a critical task the answer is always NO!
PERT Charts PERT Charts Not named after Mr Pert! Stands for Program Evaluation and Review Technique
PERT basics • PERT is an acronym so it’s in capital letters • Gantt is a name, so only has an initial capital • In Gantt chart, the length of a task’s bar is proportional to the length of the task. This rarely applies to PERT charts. • There are a few different “flavours” of PERT and Gantt charts…
PERT charts • This PERT chart follows the “Activity on Arrow” style. • The tasks are shown by arrows. Task name are shown by letters, in this case. • The circles are called nodes. The nodes indicate the start or end of tasks. • Task durations are the shown by the numbers.
‘Activity on Node’ style PERT Activity on Node is a different flavour of PERT: this time the nodes are tasks, and the arrows are merely connectors. The examiners prefer very simple PERT charts – sometimes hybrid beasts that defy categorisation.
A PERT PROBLEM A PERT PROBLEM
1: Which tasks are on the critical path? • 2: What is the slack time for tasks C, D and G? • 3: Task C is delayed by one day. What impact would this have on the completion date of the project? Why? • 4: Task A will be delayed by 2 days because some equipment has arrived late. If the project manager wants to finish the project on time he will need to shorten the duration of one or more of the tasks. How can he achieve this? • 5: The project manager reduces the durations of tasks D and F by one day each. How will this affect the finishing date of the project?
1: Which tasks are on the critical path? Possible paths: A,B,C,E,I = 2+3+1+4+3 = 13 days A,B,D,F,I = 2+3+3+3+3 = 14 days A,G,H,I = 2+2+5+3 = 12 days ANSWER: A,B,D,F,I
2: What is the slack time for tasks C, D and G? TASKS C and D… Path C,E = 5 days, Path D,F = 6 days Difference (slack) = 1 day for tasks C or E compared to D,F TASK G… Path B,C,E = 8 days. Path B, D, F = 9 days Path G, H = 7 days. So G & H have 2 days’ slack between them. B,C or E have 1 day’s slack. B,D,F have no slack.
3: Task C starts one day late. What impact would this have on the completion date of the project? Why? No impact, because task C has one day’s slack (as discovered in previous question!)
4: Task A will be delayed by 2 days because some equipment has arrived late. If the project manager still wants to finish the project within the original time frame, he will need to shorten the time for one or more of the tasks. What steps can he take to reduce the number of days allocated to a task? The answer has NOTHING to do with the chart! Just say how jobs can be finished more quickly, e.g. bringing in extra workers from slack tasks, working longer hours, working weekend, streamlining work practices, automating tasks etc.
5: The project manager decides to reduce the time needed for tasks D and F by one day each. How effective will this reduction be in achieving his aim of maintaining the original finish time for the project? It is only partially effective. Reducing tasks D and F by one day each means the path A,B,D,F,I is now 12 days long. However, path A,B,C,E,I is still 13 days so it becomes the longest path, and therefore becomes the new critical path. The project is now 13 days long instead of 14, a saving of only one day.
Some Gantt / PERT Terms • Lead time • Occurs when a task should theoretically wait for its predecessor to finish, but can actually start a little early. The time that the tasks overlap is lead time. E.g. when replacing computers in a computer lab, you could actually start bringing in the new computers while the old ones were being packed up and moved out.
Some Gantt / PERT Terms Lag time The minimum amount of time that must pass between the finish of one activity and the start of its successor(s). For example, if task A is laying a house’s concrete slab, and dependent task B is putting up the house walls, there would need to be some lag time between the end of task A and the start of task B to let the concrete set. Lag time is shown in a PERT chart as an arrow with a duration but no task assigned to it.
Some Gantt / PERT Terms Dummy Task Shown by a dotted arrow on a PERT chart, it shows a dependency but no task. The next example shows this…