Download
1 / 27
290 likes | 395 Views
Learn how Providence Health & Services streamlined the denial management process to identify reimbursement opportunities, prevent losses, and achieve financial efficiency. Discover their strategic approach and successful workflows.

E N D
Turning Denials in to Opportunities Mike Jacobson Providence Health & Services | Oregon October 21, 2010
Alaska Montana Polson Great Falls Valdes Seward Kodiak Anchorage Missoula Washington California Everett Seattle Issaquah Colville Chewelah Deer Park Spokane Oregon Olympia Centralia Chehalis Hood River Portland Newberg Milwakie Mt. Angel Seaside Yakima Walla Walla Oakland Mission Hill North Hollywood Burbank Torrance San Pedro Medford Hospital Spotlight
Hospital Spotlight – cont. System Mission Statement As people of Providence, we reveal God’s love for all, especially the poor and the vulnerable, through our compassionate service Oregon Region Vision As people of Providence, we will provide a connected experience of care built on a foundation of clinical excellence.
Portland Hood River Seaside Newberg Mt. Angel Medford Hospital Spotlight – cont.2009 Data Seven Hospitals – GR $3,2B • Acute Admissions: 66,252 • Hospital OP Visits: 2,883,551 57 Employed MD Clinics – GR $297M • Primary Care Visits: 1,127,160 Home Services – GR $185M • Home Health Visits: 212,616 • Hospice Days: 190,584 Total Gross Rev (with health plan): $4.6B Statistics • Charity 5.44% • Bad Debt 1.84% • A/R Days 43 • Uninsured 7.75% • Community Benefit $209M
Denial Management Goal Design a standard, accurate process to identify and collect all reimbursement, while reporting potential loss prevention opportunities to the correct department.
Adopting a Strategic Approach to Denial Management Approach: to review the current process and identify opportunities: • Define what a “denial” is • Audit, audit, audit -- Pre-billing edits, CCI edits, adjustments / write-offs, ERA CAS codes, paper correspondence, partial reimbursements, refund requests, etc. • Document current flows -- Appeal letters, hand-offs, reporting, account documentation, follow-up steps, policies, etc. • Redesign workflows and update P&P’s • Educate team(s) on appropriate adjustments and flows • Implement • Audit, audit, audit
Streamlining Workflow by Standardizing Reason Codes Challenge: Standardizing denial reason codes from payers Prior state (approximately 2 years ago) • Payers using different denial reasons; anywhere from 110 – 180 different denial codes being received • The teams would manually review the account to determine denial reason • Team had to change hats – flipping between different denial reasons • Process was cumbersome and difficult Goal: To standardize this information/responses from payers, and drive processes based off that standardization. We want to direct the work to specialist on the denial management team that will work common (same) denials.
Streamlining Workflow by Standardizing Reason Codes – cont. Approach: extensive review of all response codes from payers, whether through electronic posting or manual cash posting • Created a “denial crosswalk;” Taking all response codes from payers and translate them into OUR denial code example: one payer had 5 different experimental/investigational denial codes – those are normalized into ONE internal code for us • Accounts are then directed to individual specialists on the team or to a automated response • Then based on the denial, specific denial specialists follow the newly implemented workflow
Streamlining Workflow by Standardizing Reason Codes – cont. Now that we have a standardized response, we can drive denials in different directions: 1. Automated response to denial – based on identified denials, we script responses versus having a person work them. (i.e. no coverage, accident information, student status, etc. Even some of our medical necessity denials.) 2. Specialist review/respond to denial – Specific denials that need interaction are driven to people who are responsible for those denials.
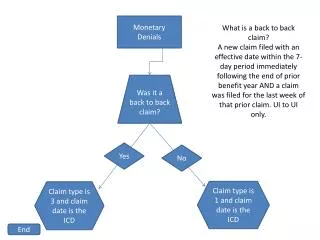
Streamlining Workflow by Standardizing Reason Codes – cont. Med Necessity Denial – goes to UM/QM/Dr. Denial Crosswalk Our Denial Database No Auth Denial: Goes to a specialist to audit/appeal. Automated Response: Scripting letters to patients/payers
Developing Electronic Statusing Functionalities Challenge:Lack of standardization in denial processing and notification from payers Prior Process: • Claims “pended or delayed” at the insurance with untimely or no communication to provider • 276 and 277 inconsistent and inefficient • Staff tracing claims on the payer webpage to identify the payment status - 7 out of 10 were “claim in process” Goal:Automated entire claims tracing process, so the right staff person is touching only claims needing additional work
Streamlining Workflow With Automated Claims Status You might ask “Why go looking for denials?” • The sooner it’s worked the sooner it’s paid • If resolved prior to formal denial, saving patients hassle of the denial process and from getting statements • Avoids multiple people touching or intervening once formal denial received from the payer
Streamlining Workflow With Automated Claims Status - HOW? • Daily extract of unpaid claims for specific payers based on predetermined criteria. • Using a scripting tool (Boston Workstation) • Enter account information into the payer website exactly like a person would • Capture the claim status information from the payer website • Uploads (document) the claim status information back into our host • When claims are “in paid status” resets follow-up date, to avoid further “touches”
Developing Electronic Statusing Functionalities – cont. What does this get us? • Automated claim statusing – something that has been a struggle in the Oregon market • Reduce the teams need to do claim statusing; the team avoids working on accounts that are “in process” • By working accounts that need our intervention – we create payments and resolve accounts • Allows us to build a database of payer denials to track/trend What do we need to keep an eye on? • When the payer changes their webpage, our script might error out • Need to monitor changes the payer makes to their pending/denial codes – since that is driving our account follow-up
Developing Electronic Statusing Functionalities – Results!!! • One PC can trace and document 4.5 accounts per minute – versus manually at 1 account per minute. --On average 25% required additional; 75% don’t need intervention, won’t be on a work list and we won’t send statements • Claim statusing is happening outside our business office hours of operation. • Accounts needing follow-up are driven to the appropriate person based on pend/denial reason. • Strengthening of our report capabilities – since account notes are scripted with the claim status information, we can query the denial reason for each payer. • Scripting tool has a 100% attendance record.
Creating Efficiencies Through Alignment of Staff Challenge: Constant training of new staff and inconsistent accuracy Prior Process: • All teams in the Business Office worked denials • Inconsistent processes, accuracy, training and education • Unintended write-offs • Inability to accurately report losses and opportunities • Denials worked to varying degrees Goal: • Use our tools to stratify denial work based on staff skill set and complexity of work needed • Sustainable model, not impacted by staff turnover or vacancies • Eliminate hand-offs between teams; one point of accountability; from working denial, to appeal, to writing off • Confidence that every possible dollar was being pursued adequately • Accurate, timely reporting to CFO’s
Creating Efficiencies Through Alignment of Staff – cont. Because of our new Denial Management structure, as well as Claim Statusing and standardization of denial responses, we are aligning the team to specialize in functions – specialists works denial types vs. specific payer: Efficiencies Gained By: • Grouping Denials • All “like” denials are gathered daily and built in worklists • Driven to specialties • No Hand Off’s: A person specializes in a denial – they are experts in the adjusting off the account; appealing denials; and are responsible to audit denial adjustments each month • Sustainable: Each specialist is also responsible for keeping up-to-date documentation on what payers need when appealing the denial • Creates Depth: Cross-training about every 60 days so everyone is exposed to more knowledge and different types of appeals • Improves payer tracking/trending
Communicating Information Upstream Improved feedback to teams: • To Access Services – identifying areas that new authorizations are needed or processes needing change • To medical departments – showing what services are being denied • To contracting team – shows volumes of denials by payer • To CFO’s – able to show how much currently denied, how much in appeal process and then how much is likely to written-off (based on appeal success by payer)
What’s Next? • Score denials based on scale of dollars impacted and degree of difficulty. (slide) • CFO scorecard – shows areas of greatest concern. • Payer scorecard – improve communication (slide)
What’s Next? – Cont. Length of Stay Denial Member not eligible No Authorization Denial Low $ Return High Prudent Layperson Appeal Easy Complexity Hard