Download
1 / 29
290 likes | 409 Views
A Busy Educational Summer: WI School Report Card, new Cut Scores, and Multiple DPI Initiatives. Updates from the latest and greatest DPI trainings. Eric Larsen CESA 8 School Improvement. Major Shifts. PALS Kindergarten Screener 2012-13. Need for Data Understanding and Analysis 2012-.

E N D
A Busy Educational Summer:WI School Report Card, new Cut Scores, and Multiple DPI Initiatives Updates from the latest and greatest DPI trainings. Eric Larsen CESA 8 School Improvement CESA 8 School Improvement 2012
Major Shifts PALS Kindergarten Screener 2012-13 Need for Data Understanding and Analysis 2012- Accountability Reform 2011-12 to 2013-14 Common Core State Standards Since 2010 Smarter Balanced Assessment 2014-15 Student Information System 2012-17 Educator Effectiveness 2014-15
Higher Expectations for all our Students • The Waiver from NCLB has a major impact on standards, assessment, accountability, and graduation requirements • The goal is for students to navigate through a challenging curriculum and be prepared for a college or career upon high school graduation. • http://www.dpi.wi.gov/oea/acct/accountability.html CESA 8 School Improvement 2012
More Additional Resources • As we continue to move forward with unified messaging, DPI is also creating many documents that can help in these efforts to explain all these changes to your constituents. • Numerous fact sheets, presentations, and letters are available, with more documents to come as created. • http://dpi.wi.gov/sprntdnt/2017_resources.html is the link on the WI DPI website. CESA 8 School Improvement 2012
Standards update: • Common Core State Standards • Mathematics • English Language Arts • Disciplinary Literacy • Common Core Essential Elements • Implemented 2014-15 • Science- Public draft 2nd review fall of 2012, implementation spring 2013 • Social Studies- Public Draft mid-November. Final standards by Summer, 2013 • Science and Social Studies adoption and implementation will occur later. CESA 8 School Improvement 2012
DPI going a new Direction • Content and Learning Team is dividing • A NEW Common Core Implementation Team is being created. • Led by Emilie Amundson, Director • Will contain all Math, ELA, Literacy folks. • Diana Kasbaum, Tamara Maxwell plus new hires in each content area. Also Reading and all Literacy. • Will start building on “Investigations” work and help develop curricular resources. • Will work with IHEs, CESAs, and other stakeholders to develop and disseminate curricular resources. CESA 8 School Improvement 2012
New Assessments are coming: • Proficiency will be measured by new assessments: • WKCE Smarter Balanced (2014-15) • WAA-SwD Dynamic Learning Maps (2014-15) • ACCESS ASSETS (2015-16) for ELL students • New assessments and Common Core instructional resources will incorporate Universal Design for Learning principles. • New Kindergarten assessment, as required in Act 166, is a screener used to identify struggling readers as soon as possible. • Phonological Awareness Literacy Screening (PALS) developed by the University of Virginia. • PALS reading screener begins immediately (2012-13) CESA 8 School Improvement 2012
PALS Literacy Screener Information • Wisconsin Act 166 requires that an early literacy screener be administered to all kindergarten students. • DPI was charged with selecting a screener that: • Is valid and reliable • Assesses phonemic awareness and letter sound knowledge • Will begin in the 2012-2013 school year • PALS data should be used to inform early childhood instruction. Screeners are an effective component to an early warning system. • PALS is a screener. It is not part of the School Report Card and is not to be used for accountability purposes. CESA 8 School Improvement 2012
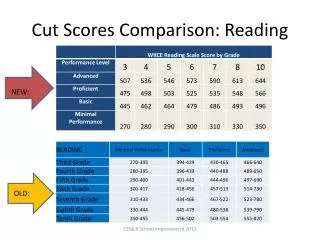
As we prepare for the new report card……. • Understand that cut scores have changed. • Previous cut scores were as low as 13.5 percent to pass a level of proficiency. • Now, it will take an average 64% in reading and a 52% in math to meet the new levels. • Advanced for both is in the mid 90% • This new system sets a bar that kids must pass. CESA 8 School Improvement 2012
Cut Scores Comparison: Reading NEW: OLD: CESA 8 School Improvement 2012
A visual for the OLD Reading cut score table…. CESA 8 School Improvement 2012
A visual for the NEW Reading Cut Score table….. CESA 8 School Improvement 2012
New Mathematics Cut Scores NEW OLD CESA 8 School Improvement 2012
A visual for the OLD Math Cut Score table CESA 8 School Improvement 2012
A visual for the NEW Math Cut Score table. CESA 8 School Improvement 2012
These changes lead to our new accountability report card: Differentiated Accountability and Support • The new accountability system has been built around four priority areas, to allow for differentiated reporting across multiple measures. • Instead of only using state test scores to measure school effectiveness, the new system uses multiple measures. CESA 8 School Improvement 2012
Priority Areas • Student Achievement An indication of how the students’ level of knowledge and skills in a school compares against state and national standards. • Student Growth An indication of how rapidly a school’s students are gaining knowledge and skills from year to year. This area focuses not on attainment, but the pace of improvement in student performance, no matter where students begin. All improvement is treated as a positive. • Closing Gaps An indication of how much the school is contributing to the closing of statewide achievement gaps. • On-track to Graduation/Postsecondary Readiness An indication of how successfully students are achieving educational milestones that predict postsecondary success.
Accountability Index • A comprehensive accountability index has replaced the AYP pass-fail system. AYP reports are gone; accountability reporting will now be done with School Report Cards (2011-12). • The index is a composite of sub-scales that measure performance across four priority areas : • Student Achievement • Student Growth • Closing Gaps • On-track to Graduation/Postsecondary Readiness • The index score is on a 0–100 scale. Sub-scale scores as well as the index score will be reported to enhance transparency and differentiation. • Student Engagement indicators, if missed, result in a deduction to index score • Test Participation Rate • Absenteeism Rate • Dropout Rate
Accountability Ratings schools will receive: State Interventions 53-62.9 State Interventions Many Priority Schools 52.9 and below Local Improvement Efforts 63-72.9 Reward School 83-100 Reward School 73-82.9 Where most schools will be High Performing Low Performing
A new Change: • The report card will be split into two separate documents. • This page will be the school report card. • Front will be this page • Back will include simple explanations of data. • The additional 12 pages will be call the report card detail • Numbers to explain the report card indices. CESA 8 School Improvement 2012
New Elementary/ Middle Report Card Categories Overall School Score Based on 4 Indices School information and sub-group information All previous years WKCE scores converted to new NAEP cut scores for five years CESA 8 School Improvement 2012
Continued • The four priority areas are scored as follows: • Student Achievement- 25% • Student Growth- 25% • Closing Gaps- 25% • On track indicators: • Elementary • 20% attendance • 5% 3rd grade WKCE Reading Scores • Middle • 20% attendance • 5% 8th grade WKCE Mathematics Scores CESA 8 School Improvement 2012
Student Engagement Indicators • The old RED flags • School scores will face deductions • Test participation of the lowest subgroup • 3 year average • must be over 95% • All students, not just FAY • Absenteeism Rate • No more than 13% • Dropout Rate • No more than 6% CESA 8 School Improvement 2012
The High School Report Card • A few small differences: • Scoring: • Student Achievement: 37.5% • Student Growth 0% • Closing Gaps: 37.5% • On Track/ Post Secondary Readiness: 25% • 20% is the graduation rate • 5% ACT Participation and Performance CESA 8 School Improvement 2012
Report Card Detail Student Achievement • A three year average for Math and Reading • Different weights for scores • Advanced: 1.5 • Proficient: 1 • Basic: .5 • Weighted • Current year 1.5 • Last year 1 • 2 years ago .5 CESA 8 School Improvement 2012
Report Card Detail Student Achievement, Cont. • Sub Group data • Breaks out each of your sub groups and shows exact percentages of each in the Math and Reading Advanced, Proficient, Basic and Minimal categories. CESA 8 School Improvement 2012
Report Card Detail Student Growth • Only Elementary and Middle School • Looking at a trajectory of expected performance of students • Will give points for growth across categories • A point for every category you move up • Ex: Minimal to Advanced earns 3 points, proficient to Advanced earns 1point. • Will deduct points for regression • Only proficient to basic/ minimal • Ex: Proficient falling to minimal loses 2 points • Basic students who fall will lose points in an overall complex formula • Green is Good, Red is bad. CESA 8 School Improvement 2012
Report Card Detail Student Growth • Breaks out growth by sub-group • Displays the amount of kids increasing and declining in each category. CESA 8 School Improvement 2012