Download
1 / 29
300 likes | 513 Views
Statistical Evaluation of Dissolution for Specification Setting and Stability Studies Fasheng Li Associate Director, Pharmaceutical Statistics Worldwide R&D Pfizer, Inc 37 th Annual MBSW Muncie, IN May 20, 2014. Motivation.

E N D
Statistical Evaluation of Dissolution for Specification Setting and Stability StudiesFasheng LiAssociate Director, Pharmaceutical StatisticsWorldwide R&DPfizer, Inc37th Annual MBSW Muncie, INMay 20, 2014
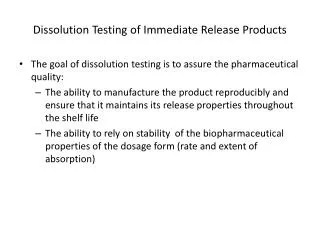
Motivation • Dissolution routinely tested to provide in vitro drug release information • Drug development: prediction of in vivo drug release profiles • Quality control: assessment of batch-to-batch consistency • Decision making during dissolution method and drug development • Data based specification setting for USP <711> dissolution test • Dissolution monitoring on stability • Statistical assessment integral to decision making process. 2
Outline • Setting Extended Release Dissolution Specifications • Number of time points needed • Case 1: Two-point spec • Case 2: Three-point spec • Evaluation of possible specifications • Dissolution on Stability • No significant linear trend observed • Non-linear trend observed 3
Dissolution Specification Setting How many time points are necessary for setting dissolution specifications? • Based on “Guidance for Industry: Extended Release Oral Dosage Forms: Development, Evaluation, and Application of In Vitro/In Vivo Correlations”, at least three points (early, middle, late) on the dissolution profile should be used to have specifications • Are fewer than three time points sufficient? • Are three time points enough? 4
Dissolution Spec Setting – Case 1 • Mean disso profiles of three typical batches of a sustained release drug product • Proposed to have specs at two time points (30 and 180 minutes) • Team discussed to add a spec at either 15 or 60 minutes Specs at 30 and 180 minutes Add either 15 or 60 minutes? 5
Dissolution Spec Setting – Case 1 , • An empirical first-order two-parameter non-linear regression model fit to the release profiles • Goodness-of-fit of the model evaluated by a coefficient of determination R2-type measure • Model appropriateness evaluated by the lack-of-fit test R2 = Release = A(1-e-bt) is a two-parameter Weibull model 6
Dissolution Spec Setting – Case 1 , • Dissolution profiles defined well by a two-parameter release model • Mathematically, any two points on the profile would be able to sufficiently define the release profile • No need to add a third time point for specification • Team agreed to set disso specifications without a third point Two-point spec 7
Dissolution Spec Setting – Case 2 • Mean disso profiles of three typical batches of a extended release drug product • Originally specs at 5 time points proposed; should 1 more be added to improve control? • Question: How many time points are needed for setting dissolution specifications? 8
Dissolution Spec Setting – Case 2 , • An empirical three-parameter non-linear regression model (Weibull ) fit to the release profiles • Goodness-of-fit of the model evaluated by a coefficient of determination R2-type measure • Model appropriateness evaluated by the lack-of-fit test Three-point spec R2 = • The three-parameter Weibull model is sufficient and adequate to define dissolution profiles in this case • Recommend three-time points for dissolution specifications 9
Brief Summary , • Three-point specifications are apparently more advantageous than six-point specifications: • Cost Savings • Save 50% reducing from 6 to 3 time points • Quicker Analytical Results • Conformity Risk Reduction: Assuming the probability of passing USP <711> dissolution test at each time point is the same (e.g. 98%), the overall probability to pass: • 0.983 = 94% with three time points • vs. • 0.986 = 89% with six time points 10
Evaluation of Dissolution Specifications , • After Determining Number of Time Points • Evaluate proposed dissolution specifications against USP <711> at each time point • Recommend new dissolution specifications if necessary • Statistical Approach • Simulations performed on individual dissolution data at each of the specification time points to check the probabilities of passing different stages (L1, L2, and L3) of USP <711> dissolution test 11
USP <711> Dissolution Test Acceptance Criteria for Extended Release Drug Products 12
Evaluation of Dissolution Specifications • Controlled release product specs: • @1 hour: <= 30% • @4 hours: 40-60% • @24 hours: >= 80% • Re-evaluate specs due to method change • Data: 46 unique dissolution conditions • Each have 6 to 96 individual disso profiles • A total of 1578 disso profiles collected Current three-point specifications 50000 simulations performed on 46 dissolution data sets to check probabilities of passing USP <711> stages (L1, L2, and L3) 13
Evaluation of Dissolution Specifications Comparable Specs Proposed Specs 14
Evaluation of Dissolution Specifications • Controlled release product - recommended specifications for new dissolution method • @1 hour: <= 30% • @4 hours: 35-55% • @24 hours: >= 80% Individual Dissolution Profiles Revised three-point specifications Mean Dissolution Profiles Revised three-point specifications 15
Brief Summary – Disso Spec Setting , • The number of time points on dissolution profiles used for specification setting • Can be justified by fitting a non-linear release model • Based on the number of parameters of the non-linear release model • Specifications at each time points • Can be evaluated by performing simulations on dissolution data against USP <711> criteria • Calculate the probability to pass USP criteria 16
Dissolution on Stability Dissolution usually monitored on stability as a numerical quality attributes with numeric specifications • e.g. %Release at 6 hours should be between 40-60% • Dissolution data may not have a significant linear trend along stability time • Linear trends not significant • Non-linear trends observed • How to evaluate dissolution data on stability? Typical Q1E shelf life analysis not appropriate. 17
Dissolution on Stability – No Linear Trend Clear linear trend for the chemical impurity data ICH Q1E Analysis Appropriate Linear Trend ICH Q1E Analysis is not meaningful • No overall statistically significant trend in dissolution at 10 hours No Statistically significant Linear Trend 18
Dissolution on Stability – No Linear Trend • Shelf-life predicted based on the major chemical impurities: Apply linear regression analyses following the ICH Q1E guidance • The risk of failing dissolution on stability will be quantified • Make sure the risk of failing dissolution spec is low • Utilize dissolution profiles tested at each of the stability time points 19
Dissolution on Stability – No Linear Trend • A three-parameter Weibull model: • %Release = A(1-exp(-b*tm)) • fit to all mean or individual dissolution profiles at each of the stability time points for all registration stability batches • The risk of failing dissolution at a future stability test time since time is not relevant can be quantified by • Constructing prediction limits with confidence level p% • Checking the limits against the spec of (45, 65) • If the prediction limits are within the spec limits, the risk of failing a future average dissolution would be no more than 100-p% 20
Model fit mean dissolution profiles of stability times points very well (R2 > 0.99) • The risk of failing dissolution test on stability at a future time is no more than 0.9% Risk of Dissolution on Stability 21
Dissolution on Stability – No Linear Trend Risk of failing disso on stability is < 0.9% 22
Dissolution on Stability – No Linear Trend Risk of failing disso on stability is < 0.7% 23
Dissolution on Stability – Non-linear Trend Extended release product: with a clear non-linear trend for dissolution data at x hours 24
Dissolution on Stability – Non-linear Trend • Empirical model of: • %Release at x hours = A(1-e-b*(t+t0)) • can be fit to dissolution at x hours from manufacturing age for all registration stability batches • Shelf life (in terms of manufacture age) can be predicted when the 95% confidence interval intersects with the spec limits • Shelf life (in terms of stability storage age) can be determined by subtracting the manufacturing age of the initial stability time point (stability time 0 month) 25
Dissolution on Stability – Non-linear Trend • Stability program started at 7.4 months of manufacturing age • Predicted shelf life is about 54.5 -7.4 = 47.1 months 26
Brief Summary – Dissolution on Stability , • Stability dissolution data often show no significant linear trends • No significant linear or non-linear trend • Dissolution profile data can be utilized to remediate the risk of meeting dissolution specifications • More information used versus evaluate at 1 time point on the profile • Non-linear trend • Empirical non-linear model fit to stability data could help justify the prediction of shelf life 27
Summary • Dissolution for extended release drug products facing decision makings in areas such as • Setting Specifications • Number of time points on the profile for spec • Specification limits at the time points • Dissolution on Stability • No significant linear trend • Non-linear trend • Statistics will be able to contribute greatly in the above areas to make regulatory appealing decisions • Statisticians need to work proactively with team scientists
Acknowledgment Kim Vukovinsky, Senior Director, Pharmaceutical Statistics, Worldwide R&D, Pfizer Inc.