Download
1 / 22
250 likes | 494 Views
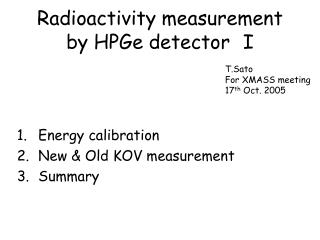
Radioactivity measurement by HPGe detector I. T.Sato For XMASS meeting 17 th Oct. 2005. Energy calibration New & Old KOV measurement Summary. 1.Energy calibration( 57 Co). 60sec data. 14.1kBq. 122keV. 136keV. 1.Energy calibration( 133 Ba). 60sec data. 15.7kBq. 276keV. 303keV.

E N D
Radioactivity measurementby HPGe detectorI T.Sato For XMASS meeting 17th Oct. 2005 Energy calibration New & Old KOV measurement Summary
1.Energy calibration(57Co) 60sec data 14.1kBq 122keV 136keV
1.Energy calibration(133Ba) 60sec data 15.7kBq 276keV 303keV 81keV 356keV 384keV
1.Energy calibration(137Cs) 60sec data 18.7kBq 662keV
1.Energy calibration(60Co) 60sec data 16.3kBq 1173keV 1333keV
1.Energy calibration Y(keV) = P1 + P2 x X(channel) P1 = (0.34783 ± 0.86422)×10-2 P2 = 0.40051 ± 0.00001 ~0.4keV/channel
Estimation of radioactivity 60Co : 1173keV 99.97% 1333keV 99.99% 40K : 1461keV 11% U-chain : 214Pb 295keV 19.3% 214Pb 352keV 37.6% 214Bi 609keV 46.1% 214Bi 1120keV 15.1% 214Bi 1764keV 15.4% Th-chain: 212Pb 239keV 43.3% 228Ac 338keV 11.3% 208Tl 511keV 22.6% 208Tl 583keV 84.6% 228Ac 911keV 25.8% 228Ac 969keV 15.8% 208Tl 2615keV 99%
Analysis plot KOV-NEW(1173keV) (count/sec) Peak area P0 fit
3.Summary plot 1 OLD NEW ×10-3 ×10⁻³
3.Summary plot 2 OLD NEW ×10-5 ×10⁻⁵
Peak detection efficiency OLD NEW (Fe=54%,Ni=29%,Co=17%) Point like Air(50mm*50mm*6mm) Kov(50mm*50mm*6mm) Point like Air(50mm*50mm*1mm) Kov(50mm*50mm*1mm) Air&Kov 1e4 events@each point Air&Kov 1e6 events@each point Error = 0.44%@609keV(kov) Error = 3.85%@609keV(kov)
Interaction probability in KOV(6mm) (%) ((air_eff – kov_eff) / air_eff)*100 Interaction probability
3.Summary plot 3(=plot 2 /eff) OLD NEW ×10-3 ×10⁻³ No big difference
3.Summary • Old and New KOV measurement by HPGe. • There is no big difference, but new kov has a low Co content than old one. To Do • Analysis about another samples, especially about 40K in PMT parts or One PMT.
2.New & Old KOV measurement OLD NEW Data Data BG BG
2.New & Old KOV measurement OLD NEW
2.New & Old KOV measurement OLD NEW
2.New & Old KOV measurement OLD NEW
2.New & Old KOV measurement OLD NEW
2.New & Old KOV measurement OLD NEW