Download
1 / 30
300 likes | 377 Views
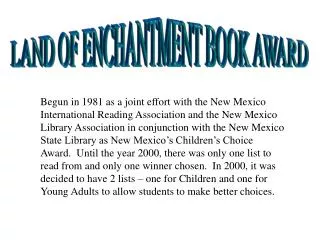
NAEP in the Land of Enchantment. Dr. Ed Gilliland Program Manager Assessment and Evaluation Bureau and New Mexico NAEP State Coordinator New Mexico Public Education Department. What is NAEP?. The National Assessment of Educational Progress Also referred to as “The Nation’s Report Card”

E N D
NAEP in theLand of Enchantment Dr. Ed Gilliland Program Manager Assessment and Evaluation Bureau and New Mexico NAEP State Coordinator New Mexico Public Education Department
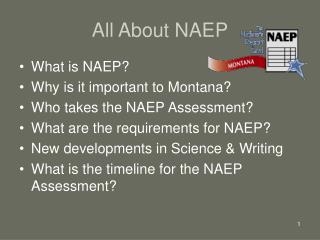
What is NAEP? • The National Assessment of Educational Progress • Also referred to as “The Nation’s Report Card” • The only nationally representative, continuing assessment of what students in the U.S. know and can do in school. • Mandated by the U.S. Congress and administered by the U.S. Department of Education’s National Center for Education Statistics (NCES) • Administered periodically to students in fourth, eighth, and twelfth grades in a variety of subjects. • Allows states to compare their students’ performance both over time and to the performance of students nationally and in other states.
What does NAEP include? • State and national assessments in reading, mathematics, science, and writing. • National assessments in U.S. history, world history, geography, civics, economics, foreign language, and the arts. • Long-term trend assessments. • Trial urban district assessments. • Field tests and pilot tests. • Special studies (e.g., the High School Transcript Study, the National Indian Education Study).
NAEP in the Era of No Child Left Behind (NCLB) • States and local education agencies (LEAs) that receive Title I funds are required to participate in state NAEP assessments in reading and math. • NAEP may not be used by the federal government to establish, require, or influence the standards, assessments, curriculum, including lesson plans, textbooks, or classroom materials, or instructional practices of States or local educational agencies. • However, NAEP does serve as a “serious discussion tool” in the federal government’s ongoing review of state accountability systems.
“Serious Discussion Tool”Hypothetical Scenario 1 “Keep up the good work.” J
“Serious Discussion Tool”Hypothetical Scenario 2 “We need to have a serious discussionabout your state accountability system.”L
2005 NAEP Schedule • State (and national) assessments in reading, mathematics, and science – Grades 4 and 8 • National assessments in reading, mathematics, and science – Grade 12 • Pilot tests/field tests: reading, mathematics, U.S. history, civics, economics • Small study in science • National Indian Education Study (special study) • High School Transcript Study (special study) ------------------------------------------------------ • NAEP test window is January 24 – March 4, 2005 • Districts/schools that have been selected for participation will be notified in September
State Assessments Approximately equal sample sizes for each state About 100 schools selected for each grade and subject About 2,500-3,000 students are assessed in each grade and subject In each selected school, approximately 30 students (selected at random) are assessed in each subject National Assessments Samples of several hundred schools selected from across the country for each assessment Samples selected from states in close proportion to the student population size Therefore, the New Mexico sample is typically very small NAEP Samples
How are Schools Selected for Participation in NAEP? • School lists obtained from NCES Common Core of Data (CCD), as updated by NAEP State Coordinator • School list stratified along two dimensions: • Type of location (large central city, urban fringe of mid-size central city, small town, rural outside MSA, etc.) • Proportions of students in 2nd and 3rd largest ethnic groups (sometimes confusingly referred to by NCES and NAEP contractors as “minority enrollment”) • Sample allocated proportionately among the cells created by this stratification • Within cells, schools ordered by size (grade level enrollment) • Schools selected from within cells using systematic, probability proportional to size sampling • Large schools more likely to be selected than small schools • Schools with more than 1% of the state’s enrollment in the targeted grade are selected with certainty • Students sampled randomly within selected schools (all students at smaller schools
Unique Features of NAEP Administration • NAEP is a survey designed to produce national and state level results only. • NAEP is not a testing program for individual students or schools. • NAEP uses a unique Balanced Incomplete Block (BIB) Spiraling assessment design. • In each subject and grade, there are several different assessment booklets, with material overlapping across different booklets. • No student takes a complete NAEP assessment. • Within a school, students are assigned different assessment booklets at random. • Therefore, NAEP does not produce individual student scores. • Furthermore, NAEP does not yield reliable school or district results (except for TUDA districts).
How Does NAEP Relate to New Mexico Standards? • We have not yet conducted a formal alignment or comparison between NAEP, the New Mexico Content Standards, and New Mexico assessments. • However, informal crosswalks for mathematics show a substantial degree of overlap between the NAEP Framework and New Mexico Performance Standards for the targeted grade.
What Do NAEP Results Tell Us About Student Achievement in New Mexico? But First …
A Few Words aboutNAEP Achievement Levels • Three achievement levels: Basic, Proficient, Advanced • Four reporting categories (Below Basic is also reported) • Fairly controversial: both the process and results of NAEP achievement level setting have been described as flawed by independent evaluations • NAEP achievement levels set a high bar for proficiency • Officially remain “developmental” in nature
NAEP Achievement Levels • Basic • Denotes partial mastery of prerequisite knowledge and skills that are fundamental for proficient work at each grade • Proficient • Represents solid academic performance for each grade assessed; students reaching this level have demonstrated competency over challenging subject matter, including subject-matter knowledge, application of such knowledge to real-world situations, and analytical skills appropriate to the subject matter • Advanced • Signifies superior performance
Reading – Grade 4 New Mexico’s 2003 Average Scale Score (203) was: • At the Below Basic achievement level (≤ 207) • Significantly below the national average • Significantly higher than the average for DC • Not statistically different from AL, CA, LA, MS, and NV • Significantly lower than the state’s 1992 average • % of students at or above Basic also was significantly lower than in 1992
Reading – Grade 8 New Mexico’s 2003 Average Scale Score (252) was: • At the Basic achievement level (243-280) • Significantly below the national average • Significantly higher than the average for DC • Not statistically different from AL, CA, HI, LA, MS, and NV • Significantly lower than the state’s 1998 average • % of students at or above Basic also was significantly lower than in 1998
Mathematics – Grade 4 New Mexico’s 2003 Average Scale Score (223) was: • At the Basic achievement level (214-248) • Significantly below the national average • Significantly higher than the average for DC • Not statistically different from AL and MS • Significantly higher than the state’s averages from previous years • % of students at or above Proficient also increased significantly
Mathematics – Grade 8 New Mexico’s 2003 Average Scale Score (263) was: • At the Basic achievement level (262-298) • Significantly below the national average • Significantly higher than the average for DC • Not statistically different from AL, AR, HI, LA, and MS • Significantly higher than the state’s averages from previous years • % of students at or above Proficient also increased significantly
Additional Findings • New Mexico was 6th in the nation for Reading “gain scores” from 1994 to 1998 (ETS Study). • There is no gender gap in Math, but there is a persistent gender gap in Reading that favors girls. • The Reading achievement gap between 8th Grade Anglo and Hispanic students widened from 1998 to 2003. • The 8th Grade Reading achievement gap between economically disadvantaged and non-disadvantaged students also widened from 1998 to 2003. • The 8th Grade Reading achievement gap between the highest-achieving and lowest-achieving students also widened significantly from 1998 to 2003. • In 2003, New Mexico’s students with disabilities performed about the same as their national counterparts in Grade 4 Reading, Grade 8 Reading, and Grade 8 Math. • In 2003, New Mexico’s English Language Learners performed about the same as ELL students across the country in Grade 4 Reading and Grade 8 Math, and better than ELL students nationwide in Grade 8 Reading.
But What Do the NAEP Scores Really Mean? Item Maps Can Help!
Mathematics – Grade 4 Solve a multi-step word problem Carl has 3 empty egg cartons and 34 eggs. If each carton holds 12 eggs, how many more eggs are needed to fill all 3 cartons? * A) 2 B) 3 C) 4 D) 6 Nationwide, 46 % of 4th Grade students answered this item correctly, 52% answered incorrectly, and 2% omitted the item.
Mathematics – Grade 8 Locate ¾ on a number line On the portion of the number line below, a dot shows where 1/2 is. Use another dot to show where 3/4 is. Correct responses: or Nationwide, 64% of 8th Grade students answered the question with the correct response.
How Can the NAEP Results Help Us to ImproveInstruction in New Mexico? A lot more than what these kids seem to be learning …
Reading • Grade 4: Students who report that their teacher gives them time to read books that they have chosen themselves almost every day they have reading assignments score significantly higher than other students. • Grade 8: Students who report that they read something that is not a textbook for English class (for example, plays, fiction books) a few times a year, once or twice/month, or at least once a week score significantly higher than students who respond never or hardly ever. • Grade 8: Students who report that teachers ask them to explain or support their understanding of what they have read once or twice/month, 1-2 times a week, or almost every day score significantly higher than students who respond never or hardly ever. • Grade 4 and Grade 8: Students who report that they have been asked to write long answers to questions on tests or assignments that involved reading 1-2 times/year, 1-2 times/month, or 1-2 times/week score significantly higher than students who respond never.
Mathematics • Grade 4 and Grade 8: Students who report that they do math problems from textbooks 1-2 time a week or almost every day score significantly higher than students who report once or twice a month or never or hardly ever. • Grade 4: Students whose teachers report that they place a moderate or heavy emphasis on algebra and functions score significantly higher than students whose teachers give it little or no emphasis. • Grade 8: Students whose schools report that they offer an algebra course for high school course placement or credit score significantly higher than students whose schools do not offer such a course. • Grade 8: There is a significant positive relationship between the frequency with which teachers allow students to use a calculator for tests or quizzes and their Math score (Always > Sometimes > Never). • Grade 8: Students who report that they talk with other students about how they solved math problems 1-2 times a week or almost every day scored significantly higher than students who reported that they did so 1-2 times/month or never/hardly ever.
Want to Learn More? • NCES’ NAEP Website: • http://nces.ed.gov/nationsreportcard • Click on NAEP Questions to view items • Click on NAEP Data to analyze results • NAGB Website: • http://www.nagb.org • My Email Address: • egilliland@ped.state.nm.us