Download
1 / 43
430 likes | 582 Views
The Holy Grail: Quantitative Stability/Flexibility Relationships (QSFR). The mDCM is a heterogeneous mean field theory that directly relates thermal stability to mechanical flexibility. Livesay et al. (2004). FEBS Letters 576:468-476. Jacobs & Dallakyan (2005). Biophysical J. 88:903-915.

E N D
The Holy Grail: Quantitative Stability/Flexibility Relationships (QSFR)
The mDCM is a heterogeneous mean field theory that directly relates thermal stability to mechanical flexibility Livesay et al. (2004). FEBSLetters 576:468-476. Jacobs & Dallakyan (2005). Biophysical J. 88:903-915.
mDCM work flow… Livesay et al. (2004). FEBSLetters 576:468-476. Jacobs & Dallakyan (2005). Biophysical J. 88:903-915.
What are the DCM parameters? Fitting ubiquitin and HBP Cp measurements Jacobs & Dallakyan (2005). Biophysical J. 88:903-915.
Introducing a global flexibility order parameter = #IDF / residue
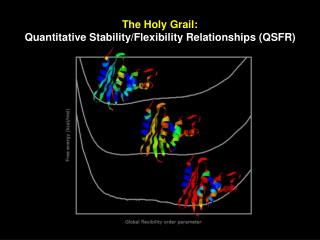
Comparison of ubiquitin and HBP free energy landscapes Ubiquitin Histidine binding protein 5.0 331 K 335 K 338 K 330 K 2.0 4.0 Relative free energy (kcal/mol) Relative free energy (kcal/mol) 3.0 1.0 2.0 1.0 0.0 0.0 Global flexibility order parameter 1.0 2.0 3.0 0.5 1.0 1.5 2.0 2.5 Global flexibility order parameter Jacobs & Dallakyan (2005). Biophysical J. 88:903-915.
Comparison of ubiquitin and HBP free energy landscapes Ubiquitin Histidine binding protein 5.0 331 K 335 K 338 K 400 K 330 K 2.0 4.0 Relative free energy (kcal/mol) Relative free energy (kcal/mol) 3.0 1.0 2.0 1.0 0.0 0.0 Global flexibility order parameter 1.0 2.0 3.0 0.5 1.0 1.5 2.0 2.5 Global flexibility order parameter Jacobs & Dallakyan (2005). Biophysical J. 88:903-915.
Model generality: Holding gmax and ddis fixed while fitting the remaining 3 parameters Livesay et al. (2004). FEBSLetters 576:468-476.
Flexibility Index Prob. to Rotate Prob. of IDOF DG(na) Thioredoxin Jacobs, Livesay, et al. (2006). J Mol Biol 358, 882–904
Gln50 Arg73 Quantifying Molecular Cooperativity Gly33 Met37 Jacobs, Livesay, et al. (2006). J Mol Biol 358, 882–904
The extent of cooperativity correlation within the ensemble is dependent on temperature
The mesophilic/thermophilic RNase H pair ** 1ril -RKRVALFTDGACLGNPGPGGWAALLRFHAHEKLLSGGEACTTNNRMELKAAIEGLKALKE 2rn2 MLKQVEIFTDGSCLGNPGPGGYGAILRYRGREKTFSAGYTRTTNNRMELMAAIVALEALKE * 1ril PCEVDLYTDSHYLKKAFTEGWLEGWRKRGWRTAEGKPVKNRDLWEALLLAMAPHRVRFHFV 2rn2 HCEVILSTDSQYVRQGITQ-WIHNWKKRGWKTADKKPVKNVDLWQRLDAALGQHQIKWEWV 1ril KGHTGHPENERVDREARRQAQSQAKT-------- 2rn2 KGHAGHPENERCDELARAAAMNPTLEDTGYQVEV Alpha-helix; Beta-strand; Catalytic site Identity conserved Chemically conserved Without conservation
“Thus the exquisite rearrangement of the hydrophobic side-chains, including some favorable aromatic-aromatic interactions, is likely to contribute to the increased stability of T. thermophilus RNase H.” Ishikawa et al., (1993) J. Mol. Biology230:529-542 Not all theories are created equal… A simple electrostatics-only model actually predicts the mesophilic ortholog to be more stable than its thermophilic counterpart! The Distance Constraint Model Poisson-Boltzmann Electrostatics pH 3.5 pH 3.5 Parameter differences are believed to retain physical meaning. Because these experiments are done under identical experimental conditions and their structures are remarkably similar, parameter differences should reflect intrinsic thermodynamic differences between the pair. Livesay, Jacobs (2006). Proteins 62:130-143.
Hollien & Marqusee (1999), PNAS Livesay, Jacobs (2006). Proteins 62:130-143.
The mDCM can identify allostery through flexibility correlation Livesay, Jacobs (2006). Proteins 62:130-143.
The mDCM can identify allostery through flexibility correlation Livesay, Jacobs (2006). Proteins 62:130-143.
Parameter error analysis indicates that the flexibility quantities are remarkably robust PR (native basin only) PR (native basin only) Livesay, Jacobs (2006). Proteins 62:130-143.
Parameter error analysis indicates that the flexibility quantities are remarkably robust A random good fit Another random good fit 10 random good vs. a bad fit E. coli A bad fit The best fit T. thermophilus Livesay, Jacobs (2006). Proteins 62:130-143.
Parameter error analysis indicates that the flexibility quantities are remarkably robust Supp. Fig. 1. Best fit u,v pairs are plotted against a coarse-grained dnat range. In all instances, the best fit u,v pairs indicate that an additional cohesive force (interpreted as hydrophobic in nature) is present within the thermophilic ortholog. The robustness of the observed cohesive force strongly substantiates the conclusions made herein regarding the improved hydrophobic packing of the thermophilic ortholog. Livesay, Jacobs (2006). Proteins 62:130-143.
QSFR variability emerges through (subtle) differences within the H-bond network
The bacterial Periplasmic Binding Protein family -- Extracellular -- -- Periplasm -- -- Cytosol -- bPBP Transmembrane domains ATP-binding domains Substrate
Diversity within QSFR arises from subtle differences within the H-bond network R = -0.97 R = 0.92
Tm ~ 10K Tm ~ 10K Comparisons to apo vs. halo DSC experiments strongly supports the diversity observed within the mDCM results mDCM results Kreimer et al. (2000), Eur J. Biochem. LAOBP GBP ligated-HBP apo-HBP
Despite flexibility similarity along the backbone, cooperatively correlation varies significantly HBP LAOBP GBP
Diversity within QSFR characteristics arise from subtle differences within the H-bond network HBP (red) vs. LAOBP (blue) HBP (red) vs. GBP (green)
Similar amounts of (dis)similarity are observed when comparing open vs. closed conformations Ligated (closed) Apo (open) Flexibility index
Not quite science fiction: The ability to design a protein with a specific cooperative response may not be that far away… Using this protocol, we designed a de novo hydrogen bond network…
A similar narrative is emerging from our comparisons of the thioredoxin family Mottonen, et al., Proteins, in press.
The TRX family Mottonen, et al., Proteins, in press.
Rigid cluster susceptibility Mottonen, et al., Proteins, in press.
Relative locations of key points describing the mechanical vs. thermodynamic transitions Mottonen, et al., Proteins, in press.
As with the bPBP family, backbone flexibility is mostly conserved across the TRX family Mottonen, et al., Proteins, in press.
As with the bPBP family, backbone flexibility is mostly conserved across the TRX family Mottonen, et al., Proteins, in press.
QSFR diversity is explained by comparing key points along the mechanical vs. thermodynamic transition Mottonen, et al., Proteins, in press.
The observed QSFR differences are consistent with the amount of differences within the H-bond network Mottonen, et al., Proteins, in press.
TRXox vs. TRXred QSFR response is a long-range effect Mottonen, et al., Proteins, in press.
A similar narrative is emerging from our comparisons of the thioredoxin family DsbAred Trxred DsbAox Trxox Periplasm (an oxidizing environment) Cytosol (a reducing environment) Mottonen, Livesay, Jacobs. In preparation.
The mDCM correctly predicts trends within known DsbA vs. Trx functional roles Mottonen, Livesay, Jacobs. In preparation.