Download

1 / 8
90 likes | 268 Views
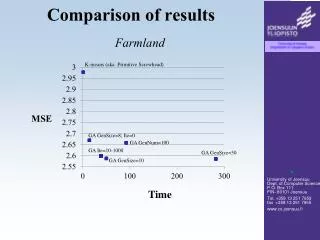
Comparison of Eddy Covariance Results. By Wendy Couch, Rob Aves and Larissa Reames. Graph of Wind speed Vs Time. Graph of Temperature Vs Time. Interpretation of Results. Low values of Friction Velocity (U * ) indicate a low impedance of mean flow due to turbulence.

E N D
Comparison of Eddy Covariance Results By Wendy Couch, Rob Aves and Larissa Reames
Interpretation of Results • Low values of Friction Velocity (U*) indicate a low impedance of mean flow due to turbulence. • Little effects of small scale turbulence. (U’W’) • Capacity of air to transport heat is low because the eddies are small. (T’W’) • Low intensity of turbulent eddies/gusts (σu/Ū). • Low surface momentum flux due to small weak eddies (τ) • The sensible heat flux (H) value is low due to moisture content of the surface and weather conditions during the IOP. • Roughness Length (Z0) higher than expected. • Low effect on momentum diffusion via turbulence (Ruw).
Differences Between Results • Generally small deviations between the two sets of results. • Siting of the masts • Different instrument errors • Small eddies affecting masts individually • Few seconds difference in starting times
Assumptions Made • Flux in the surface layer is constant with height. • Averages are appropriate for parameters calculated. (i.e. large range of H values both positive and negative)
Instrumental Effects/Problems • Time response of instruments • Threshold velocity of anemometers (instrument stalling) • Possible fluctuations between sampling points