Download
1 / 17
170 likes | 234 Views
This presentation discusses the use of Geant4 to characterize beam uniformity and energy distribution at the JPL Dynamitron electron irradiation facility. The machine, purchased in 1962, is a 3 MeV electron accelerator set up for electrons in the energy range of 0.5-2.5 MeV. Various scattering foils are used, and the irradiation environment is controlled within a vacuum. The presentation covers input parameters, post-processing techniques, energy calibration, and simulated results compared to experimental measurements.

E N D
Geant4 Simulation of Dynamitron Beam Uniformity and Energy Distribution Danielle Hohreiter Richard D. Harris Jet Propulsion Laboratory - California Institute of Technology Copy Right 2010 California Institute of Technology. ACKNOWLEDGEMENT: The research described in this presentation was carried out at the Jet Propulsion Laboratory, California Institute of Technology, under a contract with the National Aeronautics and Space Administration
Background • “The Dynamitron electron irradiation facility at JPL has been the industry standard for over 30 years. However, over the last several years, the JPL facility has been largely unavailable to the solar cell community.” Quoted from Scott Messenger early 2010 • The Dynamitron has now been repaired and is operational, however a calibration of the machine is required • Geant4 was used to characterize beam uniformity and energy distribution of the machine
JPL Dynamitron • Purchased in 1962 • Set up for electrons • A 3 MeV machine • tunable over energy range 0.5 – 2.5 MeV • Typical flux range is 1010 to 1012 e/cm2 s • Depends on scattering foils and customer needs • Irradiation environment controlled • Vacuum or air
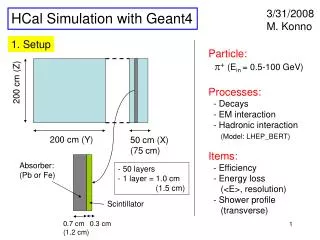
Geant4 Simulation Geometry Beam Tube window 2 mil Ti - optional 32 ½ in Scattering Foil Target plate20 cm × 20 cm Vacuum environment
Cases • Scattering foils • Aluminum • Thickness: 1, 3, 5 mil • Initial Electron Energy: 1 and 2 MeV • Titanium • Thickness: 2 mil • Initial Electron Energy: 1 and 2 MeV • Copper • Thickness: 3 mil • Initial Electron Energy: 2 MeV • Aluminum + Titanium window • Thickness: 3mil Al + 2mil Ti, 5mil Al + 2mil Ti • Initial Electron Energy: 1 and 2 MeV
Input Parameters • Physics • Standard EM physics • Beam • Particle: Electrons • Circular • 1D beam • 1 cm diameter • 100,000,000 histories
Cut-Value Comparison Values did not deviate much so the default cut-value of 1 mm was used
Post Processing • Only output particles that fall in the target area • Write Fortran code to bin energy and position values • Energy – Count energy of any particle that hits the target and bin into that energy group • Position – Bin in a matrix (both x and y position coordinates) anything that falls between -0.5 and 0.5cm will go into bin 0.
Energy Distribution of Particles that Hit Target The thicker scattering foil results in a broader peak, larger energy difference, and smaller fraction of particles at the peak A greater initial energy results in a more narrow peak
Energy Calibration • The energy distribution curves were used to calibrate the machine by determining the expected energy at the target after passing through the scattering foil. • E = Einitial – E • E due to losses in scattering foil • Einitial = 2.00 MeV • EPeak = 1.954 MeV • E = 0.046 MeV • Deviation = 2.9% • Correct machine setting accordingly Energy distribution at target plate SF = 2 mil Ti + 3 mil Al Calculated (Geant4)
Geant4 Simulation Results Thicker scattering foil results in greater area of uniformity within 5%
Geant4 Simulation Results A smaller initial energy results in greater area of uniformity within 5%
Geant4 VS Experimental Results Measured – 5% uniformity over ~10cm Geant4 – 5% uniformity over ~8cm
Geant4 VS Experimental Results cont. Measured – 5% uniformity over ~14cm Geant4 – 5% uniformity over ~9cm
Geant4 VS Experimental Results cont. Measured – 5% uniformity over >14cm Geant4 – 5% uniformity over ~14cm
Speculations for Discrepancy • Scattering from the chamber walls • The Geant4 simulation did not include the outer wall of the chamber so it would not take into account any of the scatter from the chamber walls • The beam moves during the process of irradiation • Without the Faraday cup in place to keep the beam consistently at the center it tends to bounce around slightly
Conclusion/Future Work • Geant4 has successfully been used to calibrate the Dynamitron at JPL • Future work is planned to resolve the discrepancies in beam uniformity