Download
1 / 16
160 likes | 192 Views
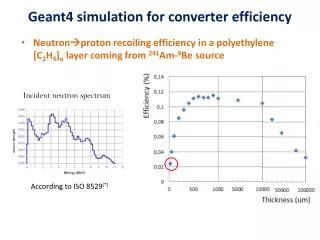
This document presents the Geant4 simulation software modules developed for the KM3 (NESTOR) project. It covers the description of the software modules, data objects, geometry module, event generation software, detector simulation, background simulation, and optical module response simulation.

E N D
Geant4 Simulation for KM3 Georgios Stavropoulos NESTOR Institute WP2 meeting, Paris December 2008
Contents • Description of the software modules developed • Data Objects • Geometry module • Simulation Software • Description of the Detector Geometry • Event Generation Software • Geant4 Detector Simulation • Background Simulation • Simulation of the Optical Module response • Conclusions – Future Work WP2 meeting, Paris, December 2008
Data Objects • DataObjects package, used by all modules • They inherit from ROOT’s TObject • TOM (Optical Module definition) • TPMT (PMT definition) • TPMTHit (single photon hit on PMT) • TPMTSignal (PMT signal definition) • TGenTrack • TRecTrack • TEventstatistics WP2 meeting, Paris, December 2008
Description of the Detector Geometry • Geometry Description package • Based on GDML is used to define the detector geometries and all the parameters related to it (depth, materials, …) • Is used by all s/w modules (simulation, reconstruction) via an independent interface package. WP2 meeting, Paris, December 2008
Description of the Detector Geometry • Using this method we created GDML-type structures describing the basic unit of our detector, the Optical Module (OM). The OM is described as a sphere. Using this GDML structure we defined the following detector geometries: • A Twelve-Floor geometry with horizontal cabling (NESTOR geometry). Twelve, star-shaped, floors, which are spaced vertically by 30m, are used to define this geometry. Each floor has 6 arms with an overall diameter of 32m. At the end of each arm there is a pair of OMs, with a 15'' PMT, one looking upwards and the other downwards. • A Cabled KM3 geometry. We created the geometry described by Els in Paris 15/10/08, with the 31, 3'', PMT OM. WP2 meeting, Paris, December 2008
Tower geometry with horizontal cabling (NESTOR geometry) WP2 meeting, Paris, December 2008
The OM of the Cabled Geometry 1. Glass sphere 6. Cooling 4. Communication Concentrator 3. PMT base 2. PMT 5. Optical interface WP2 meeting, Paris, December 2008
Description of the Detector Geometry • All the above detectors were put in a cylindrical volume filled with sea water. This cylindrical volume is defining the ‘sensitive area’ of the detector, and its dimensions were those of the detector geometry under study extended by three times the light transmition length in water (L=55m). • We used glass as the material of the OM, while the sea water was defined according to the “Simplified Synthetic Sea Water Recipe”, as defined in Table 6.3 of http://cdiac.esd.ornl.gov/ftp/cdiac74/chapter5.pdf. In this table the compositions are defined for 3.5% water salinity. In our implementation we scaled these values to the NESTOR site salinity, which from The NESTOR site, 36o 37.5 N, 21o 34.6 E. E.G. Anassontzis et. al we conclude that is ~3.87%. At the end, the optical properties of the materials, refraction index and absorption length with respect to the photon energy were defined. WP2 meeting, Paris, December 2008
Event Generation Software • Simulation of the Atmospheric Muon Flux in the Deep Sea. For the simulation of the atmospheric muon flux in the deep sea, we developed an algorithm, based on the parameterization proposed by Okada, used for the analysis of the 2003 NESTOR data. This parameterization calculates the atmospheric muon energy spectrum at various depths and zenith angles. In our implementation, we defined an orthogonal system of coordinates with its origin placed at the detector centre. The muons are produced with energy and orientation following the Okada parameterisation on a vertex which is uniformly generated on a disk perpendicular to the muon direction. The diameter of the disk is equal to the maximum horizontal distance between two Optical Modules plus six transmition lengths (the transmition length was set to 55m). The disk was placed three transmition lengths above the detector. • Single and Double Muon Generation. Generation of single/double muon(s) within a user specified range of energy, zenith and azimuth angles on a vertex(ices), uniformly generated on a disk perpendicular to the muon direction. WP2 meeting, Paris, December 2008
Geant4 Detector Simulation The detector simulation was developed in a separate software package within the Geant4 frame. Geant4, being implemented in an Object Oriented design, provides the necessary classes and methods for the development of all the necessary steps and software modules: • Event Generation. We used the tools described before, by developing the necessary software for interfacing their output to GEANT4. • Definition of the Physics processes. The physics processes, that are taking place when a charged lepton passes through the sensitive area of the detector, are developed in a separate GEANT4 software module. In this all the processes, presented in the Table of the next slide, were included using the standard GEANT4 algorithms. WP2 meeting, Paris, December 2008
The processes included in the simulation • All particles: Decays, multiple scattering, continuous energy loss, ionization and δ-ray production, Cherenkov effect. • μ-/μ+ : Bremsstrahlung, photonuclear interaction, direct (e+,e-) pair production • e-/e+ : Bremsstrahlung, e+e- annihilation • Photon : γ conversion, photoelectric effect, Compton scattering • Optical γ : Absorption, Rayleigh Scattering. WP2 meeting, Paris, December 2008
Geant4 Detector Simulation (cont.) • GEANT4 speed optimisation. In order to speed-up the simulation process, we configured Geant4 in such a way so that particles that will not contribute to the OM signal will be ignored and not tracked by Geant4. For this we developed special software that marks the Cherenkov photons that they will never hit any OM of the detector for geometrical reasons. In addition, we ask GEANT4 to ignore all particles that move away from the ‘sensitive area’ of the detector, or the ones that is physically impossible to produce any signal on an OM (like e-/e+ with energy above 240 keV). • The output of the Geant4 simulation. Special software was developed to record, and output in a file on disk, all the Cherenkov photons that hit an OM of the detector under study. The Geant4 simulation process of the Cherenkov photons ends here, leaving the simulation of the OM response to the photons that hit it, to a dedicated software package outside the Geant4 frame. WP2 meeting, Paris, December 2008
3000 1 TeV muons pointing downwards on a Cabled Geometry Θ generated uniformly between 90º and 180º Φ generated uniformly between 0º and 360º Angle between a photon and the muon EM Photons Cherenkov Photons EM Photons Cherenkov Photons WP2 meeting, Paris, December 2008
Background Simulation • In the current version of the software we simulate only the background that originates from 40K decays. • Cherenkov photons from 40K decays form a steady, isotropic background in the sea water contributing to the OM counting rate. This contribution is added to the simulation by producing more photoelectrons to each OM according to a Poisson distribution with mean the expected number of photoelectrons in the experimental time window. This rate has been measured for each 15'' PMT separately and is about 50 kHz. This number was used for both geometries, properly scaled for the multi-PMT Oms of the Cabled geometry. WP2 meeting, Paris, December 2008
Simulation of the PMT response. • The response of each PMT to the photons that hit it is simulated in a dedicated software package, taking into account • The transparencies of the various materials that make up an OM • The quantum efficiency of the photomultipliers. • The collection efficiency of the photomultipliers. • The above results to a ~10% overall photon efficiency for the 15'' PMTs and to a ~20% one for the 3'' PMTs. WP2 meeting, Paris, December 2008
Future Work • Import to KM3Tray • For more see next talk WP2 meeting, Paris, December 2008