Download

1 / 41
410 likes | 535 Views
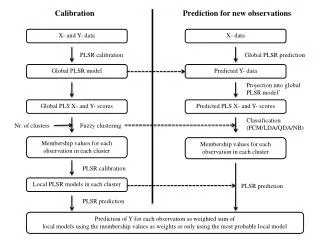
New Construction Calibration. Preliminary Research and a Request for Direction Regional Technical Forum February 19, 2013. Overview. SEEM estimates of total heating energy (Calibration Phase I) Does sample include U-values as low as NC levels?

E N D
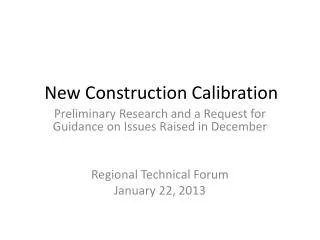
New Construction Calibration Preliminary Research and a Request for Direction Regional Technical Forum February 19, 2013
Overview SEEM estimates of total heating energy (Calibration Phase I) • Does sample include U-values as low as NC levels? • Are the captured effects and approved adjustments right for NC homes? Supplemental heat in new construction homes (Calibration Phase II) • How common is supplemental heat in NC homes with electric primary heat? • When present, does supplemental heat affect NC homes as described in the Phase II results?
Reminder: Calibration Phase I • Compared SEEM (69/64°F) energy estimates to billing estimates. • Restricted to 429 RBSA homes with well-known characteristics, no non-utility fuels, and clear heating signatures in billing data. • Regression used to determine adjustment factors that align SEEM (69/64°F) with billing data. • Approved (Modified) by RTF on Dec. 17, 2013 • Questions Raised at December Meeting: • Does the calibration sample include Uo values as low as current NC levels? • Are the captured effects and approved adjustments right for NC homes? SF RBSA Pie: 1404 Homes
Does the calibration sample include Uo values as low as current NC levels? Uo values didn’t change much between 1992 and 2008... But they seem to have have really decreased after 2008. Graph shows conductive-loss-only Uo. 1992 2008
Does the calibration sample include Uo values as low as current NC levels? • Lots of post-92 sites (137) but few post-08 sites (9) • Post-92 sites are fairly well-insulated • Average post-92 ceiling R-value is 30 • About half have ceiling R-value over 38 • But few Uo values as low as we’d like • NC measures need Uo-conductive around 0.04 to 0.07 • RBSA sample’s min is 0.052 • Only 6 below 0.055, 16 below 0.060, 44 below 0.065
Are the captured effects and approved adjustments right for NC homes? What was the Uo effect? y-axis: percent difference SEEM 69/64 - VBDD x-axis: Uo-conductive Pre-1992 Post-1992
Are the captured effects and approved adjustments right for NC homes? What do the actual adjustments look like?
Are the captured effects and approved adjustments right for NC homes? Part of the question: Will the Uo correlation hold for NC homes the same as in older homes? Not enough very-low Uo data to directly observe, but pattern clearly holds for post-92 homes as a group and for the range of Uo values we can observe (which goes almost low enough). Staff view: Seems more likely than not that the pattern would persist into the range of interest (but there’s no solid proof). But…
Are the captured effects and approved adjustments right for NC homes? Bigger part of the question: Assuming the pattern does persist, should savings calculations be based on efficient- and base-case adjustment factors that differ according to Uo? If pattern is actually due to differences in heat loss rates, then a Uo-indexed adjustment factor would be correct. • Ex. 1: Well-insulated homes have higher average inside temperatures (no cool areas on the periphery). • Ex. 2: If SEEM inputs are over-stating internal gains, then SEEM must be under-estimating heating energy; such errors would tend to be larger (in percentage terms) for the better-insulated houses.
Are the captured effects and approved adjustments right for NC homes? Bigger part of the question: Assuming the pattern does persist, should savings calculations be based on efficient- and base-case adjustment factors that differ according to Uo? If pattern is due to something else, then a Uo-indexed adjustment factor would be incorrect. (Shouldn’t debit shell measures for things that are accounted for in other measures.) • Ex 1: Better-insulated homes may tend to have better HVAC CCS than we were able to account for in SEEM runs. • Ex 2: Very well-insulated homes may tend to have tighter ducts than moderately well-insulated homes.
Are the captured effects and approved adjustments right for NC homes? Bigger part of the question: Assuming the pattern does persist, should savings calculations be based on efficient- and base-case adjustment factors that differ according to Uo? So, is the pattern actually due to differences in heat loss rates or is it due to something else? Staff view: We’re not likely to find a smoking gun on this one with feasible research. • Further research may yield adjustment factors specific to NC homes and based on NC data, • Not likely to detect NC-specific slope (the research path would probably lead to adjustments that do not depend on Uo) • Not likely to determine whether pattern is due to heat loss rates.
Options for NC U-value Issue • Consider SEEM calibrated for SF new construction; use the current model to obtain adjustments to SEEM 69/64 that vary with Uo. (Develop measures for proven status.) • Consider SEEM calibrated for SF new construction; use the current model to obtain adjustments to SEEM 69/64 based on a fixed Uo value. (Develop measures for proven status.) • Develop research plan leveraging code compliance study data. Use option 2 for provisional measure values (option 2 reflects likely form of research outcome). • Other ideas?
Decision for NC U-value Issue I move that the RTF considers SEEM 94 calibratedfor single-family new construction, and that the current Phase I model should be used to obtain adjustments to SEEM 69/64 that [vary with Uo] or [use a fixed SF NC Uo value]. OR I move that the RTF considers SEEM 94 un-calibrated for SF new construction; the current Phase I model should be used to calibrate SEEM 69/64 for provisional NC SF WX measures using a fixed SF NC Uo value. OR I move something else…
Background: Calibration Phase II • Independent of Phase I. • Based on VBDD kWh estimates—does not use SEEM estimates. • Identifies variables that drive patterns in electric heating energy among “program-like” RBSA homes. Variables relate to: - Non-utility heat sources, - Gas heat sources, and - Phase I filters. • Approved by the RTF on September 17, 2013. • Supplementary heat questions from Dec. Meeting: • How common is supplementary heat NC homes? • How do supplementary heat sources affect electric heating energy in NC homes? SF RBSA Pie: 1404 Homes
Supplementary Heat Question 1 How common are non-electric heat sources in new construction homes? Calibration captured effect of supplemental heat using three indicator variables: • Off-grid high …over 40 MBtu reported • Off-grid med (Z1) …between 5 and 40 MBtu and in Zone 1 • Gas Heat High …over 5000 kWh gas heat from VBDD analysis Has the population changed with respect to these variables?
Supplementary Heat Question 1 How common are non-electric heat sources? Does their use change with vintage? …no clear visual evidence of a `92 change in Zone 1. 1993-2011
Supplementary Heat Question 1 How common are non-electric heat sources? Does their use change with vintage? …also no clear visual evidence of a `92 change in Zones 2/3. 1993-2011
Supplementary Heat Question 1 Visual evidence Previous two graphs based on full RBSA (1400+ sites). They reveal no evidence of any change concurrent with the 1992 code change. Analytical evidence Additional slides (end of deck) look at cross-tabs (based on 585 “program-like” homes). These find no statistically evidence of any change.
Summary: Sup.Heat Question 1 Do occupants of newer program-eligible homes differ from occupants of older program-eligible homes in their usage of non-electric heat? • If so, they’ve left no evidence in the RBSA. • Have looked into sources suggested by RTF members and found no promise of better answers. • Difficult to resolve through direct observation; permanently-installed electric heat and high supplemental heat is uncommon (in any vintage)
Supplementary Heat Question 2 When present, how do supplementary heat sources affect electric heating energy? Is the effect on new construction similar to that described in the Phase II calibration model?
Supplementary Heat Question 2 Gas effect on new construction seems the same as in the Phase II calibration model. Not enough data to say anything about differential gas heat effects. (Most homes with natural gas do not use electricity as primary heat source.)
Supplementary Heat Question 2 But NC effect of non-utility heat apparently not the same as in the Phase II calibration model!
Supplementary Heat Question 2 But the net effect is the same… Ideal post-92 model would: • Increase electric heat estimate for post-92 sites with Non-utility MBtu = 0, and • Decreaseelectric heat estimate for post-92 sites with Non-utility MBtu > 40. Net effect would be to decrease post-92 average estimate by (roughly) the post-92 residual average (increase if negative). This mean (-0.03) does not differ from zero by a statistically significant amount. Staff does not recommend additional research on this issue (the phenomenon we’re after is hard to observe with enough precision to discern any difference).
Decision for NC Supplementary Heat I move that the RTF considers the supplementary heat adjustments obtained in the current Phase II calibration to be appropriate for SF NC weatherization measures. OR I move something else…
Additional Slides Phase I: SEEM estimates of total heating energy.
U-Value Question 1 Does the calibration sample include Uo values as low as current NC levels? 1992 Vintage recorded for 401 calibration sample units. Of these, 137 (34%) were 1993 or later. Only 9 were post-2008.
Are the captured effects and approved adjustments right for NC homes? y > 0 means SEEM 69/64 > VBDD • SEEM 69/64 < VBDD for very low-Uo homes • SEEM increases relative to VBDD as Uo increases • Average SEEM – VBDD difference roughly constant across high Uo values Pre-1992 Post-1992
U-Value Question 2 • So what does the pattern mean? Example: • Adjustment when Uo = 0.055 is greater than when Uo = 0.065. • Calibration adjustments were calculated relative to Uo-Both (conduction + infiltration). • Actual adjustments also depend on climate zone and heat source… Pre-1992 Post-1992
U-Value Question 2 • So what does the pattern mean? Example (continued). Adjustment factors. • Graphed for Z2 homes with elec. Res. heat. • Factor of 0.96 for Uo = 0.055; • Factor of 0.93 for Uo = 0.065.
U-Value Question 2 How do the adjustments affect shell measures? Example: Shell measure that reduces Uo-both from 0.065 to 0.055 in the prototype house. • This would decrease cold-weather heat loss rate by 0.010/0.065 = 15.4%. • Adjustment factors would reduce savings: • Efficient case adjustment factor of 0.96; • Inefficient case adjustment factor of 0.93. • This knocks about 3 percentage points off the savings rate.
Someone asked if the low-Uo homes might tend to be large recently-built homes in Zone 3. This doesn’t appear to be the case: Uo
Someone asked if the pattern might be due to the fact that a lot of homes didn’t get blower door tests (we imputed infiltration values for these in SEEM input). Doesn’t appear to be the case. If it were, then the pattern should go away for homes that had actual blower door tests.
Someone asked if the pattern might be due to the fact that a lot of homes didn’t get duct tests (we imputed duct leakage values for these in SEEM input). Doesn’t appear to be the case. If it were, then the pattern should go away for homes that had duct blaster tests. (We already knew about the zonal heat effect)
A Research Option These questions require house-level comparisons of SEEM estimates and billing data estimates. NEEA’s 2013 code compliance studies collected most of the data needed for house-level SEEM simulations (not including duct tightness or infiltration measurements). • Addresses could link to billing data (the usual limitations apply) • Data collection and analysis would be a heavy lift • Detailed calibration unlikely with this data (probably not many no-supplemental-heat homes) • Would probably let us derive calibration factors by heating zone and maybe heat source, but not varying with Uo. • May not yield reliable estimates of how off-grid and gas heat affect electric heating energy (kWh reductions would be built into adjustment factors, but cost-effectiveness off-set would be more or less made up)
Additional Slides Phase II: Supplemental heat effects on electric heating energy
Supplementary Heat Question 1 Analytical evidence for… Change in Off-grid high frequency pre-/post-1992? No statistically significant evidence: *All zones combined—results are similar when Zone 1 and Zones 2/3 are tested separately. …doesn’t rule out a change, but we have no evidence of one.
Supplementary Heat Question 1 Analytical evidence for… Change in Off-grid med (Z1) frequency pre-/post-1992? No statistically significant evidence: …doesn’t rule out a change, but we have no evidence of one.
Supplementary Heat Question 1 Analytical evidence for… Change in Gas-high frequency pre-/post-1992? No statistically significant evidence: …doesn’t rule out a change, but we have no evidence of one.
Other wood heat data sources • Super Good Cents • No wood heat data, and probably not representative anyway • NEEA Res. NC (SF and MF) Billing Analysis; SF Res. NC Characteristics and Practices(RLW, 2007) • Raw data indicated that secondary heat sources exist in large numbers, but doesn’t say what the heat sources (or fuel types) are. • Looking ahead to part of Wood Heat Question 2, no electric billing data collected for homes with gas heat. • NEEA NW EStarHomes Energy Analysis, 2006-7 (KEMA, 2010) • Unclear whether off-grid heat data was collected for this study. It’s not mentioned anywhere in the report. • NEEA Baseline Characteristics of Res. Sector (Ecotope, 2000) • Data collection form does ask about wood heat, but hard to imagine this giving better answers than the most recent RBSA. • NEEA Residential Energy Compliance Study (Cadmus, 2013) • Lots of building characteristic data for a sample representative of current NC. No wood heat or billing data.