Rational Expectations of Teenagers: Mortality, Fertility, and Education Outcomes Analysis
This research examines how teenagers (ages 15-17) form expectations about mortality, fertility, and education outcomes. Utilizing data from the 1997 National Longitudinal Survey of Youth, the study highlights systematic forecast errors in self-reported subjective probabilities. Findings indicate a tendency for teens to overestimate mortality risks while underestimating fertility and educational prospects. The results suggest that misinformation, cognitive biases, and factors such as socioeconomic status significantly affect the accuracy of their predictions. The implications of these biases for economic modeling and policy are discussed.


Rational Expectations of Teenagers: Mortality, Fertility, and Education Outcomes Analysis
E N D
Presentation Transcript
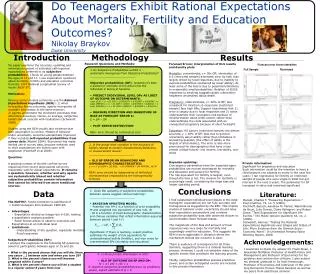
Do Teenagers Exhibit Rational Expectations About Mortality, Fertility and Education Outcomes?Nikolay BraykovDuke University Introduction Methodology Results Research Questions and Methods: • Forecast Errors: interpretation of OLS results and density plots • Mortality: overestimate; ε= 30x OP; elimination of 0.5 (restricted sample)decreases error by half; bias largely driven by focal responses, due to inability to express probabilities (explained by lower ability). At least some of the bias is due to pessimism/tendency to overpredict small probabilities. Relation of 50/50 responses to smoking suggests public information heightens uncertainty about death. • Pregnancy: underestimate, ε= 40% of OP; less consistent for direction; 0-responses (restricted sample) face high OPs; Support hypotheses that 1) error is largely due to focal responses and 2) teens underestimate their conception risk because of misinformation about birth control, rather than underestimate the costs associated with an unexpected pregnancy because of short foresight. • Education:HS juniors (restricted sample) are almost accurate, ε = 20% of OP; bias due to general uncertainty about ability rather than limitations in answering question (the effect of ability is the largest of all domains); The error is also more pronounced for demographics that have a less certain college future): low income, low-ability, non-white • Bayesian updating: • Convergence parameters have the expected signs: probabilities are revised downwards for mortality and education and upward for fertility; • The risk equivalent for fertility is largest, even though the bias is not. The revision for mortality is surprisingly small, considering the large bias and longer updating period; Forecast error Kernel densities Full Sample Restricted My paper examines the accuracy, updating and information content of individual self-reported expectations (referred to as subjective probabilities). I focus on young people between the ages of 15 and 17. I use expectation questions about mortality, fertility and education outcomes from the 1997 National Longitudinal Survey of Youth (NLSY 97). Motivation: Microeconomic models commonly use the Rational Expectations Hypothesis (REH): 1) when forecasting future outcomes, agents incorporate all available information in the same manner; 2) agents understand the stochastic processes that determine outcomes; Hence, on average, subjective beliefs should coincide with realizations (Schwandt 2009). Studies using the REH usually lack evidence that their assumption is correct. Models of behavior under uncertainty would be substantially improved if they included self-reported probabilitiesfrom survey data (Manski 2004). Economics has made limited use of survey data, because methods used to elicit expectations are looked upon with skepticism (Fischhoff et al 2009). Question: A growing number of studies confirm survey responses from recent large panels can proxy reasonably well for actual expectations. It remains a question, however, whether and why agents are systematically biased and whether subjective probabilities contain information that cannot be inferred from more traditional sources. • Do Subjective Probabilities exhibit a • systematic divergence from Objective Probabilities? • ___________________________ • Objective probabilities (OP): researcher’s best • a-posteriori estimate of the actual risk the • individual is facing at baseline • PREDICT INDIVIDUAL LEVEL OPs AS LOGIT • OF OUTCOME ON DETERMINANTS: • Logit (DIE) = α + β1 DEM + β2HEALTH + β3SUBST + β4CRIME + ε • Logit (PREGN ) = α + β1 DEM + β2SEX + β3FAMILY + β4EDUC + ε • Logit (ENROLL) = α + β1 DEM + β2EDUC + β3FAMILY + β4HLTH ε • MEASURE DIRECTION AND MAGNITUDE OF • BIAS AS FORECAST ERROR ε: • ε= SP – OP • PLOT ERROR DISTRIUTION • REH: error should be centered at zero • 2. Is the group-level variation in the accuracy of • beliefs related to certain characteristics/behaviors, • or measurement issues? • ___________________________ • OLS OF ERROR ON BEHAVIORS AND • DEMOGRAPHIC CHARACTERISTICS: • ε= α + β1 DEM + β2 ABIL + β3 SMOKER + β4 MENTAL_HLTH • REH: error should be independent of individual • characteristics (expectations are homogenously • formed) Private information: Significant for pregnancy and education Such information could be the intention to have a child because one expects to marry in the next five years: I ran regressions for fertility on restricted sample of people who were single in 2000 but got married in the next 5 years. The parameter for SP increased in value and remained significant. Conclusions • 3 . Does the updating of subjective probabilities • between waves suggest rational learning? • ___________________________ • BAYESIAN UPDATING MODEL: • Posterior risk Pt+1 is a function of prior probability • Pt and weighted risk equivalent of new info, Rt • - Rt is a function of fixed demographic characteristics • and change variables that reflect information acquired • between period t and t+1 • Hypothesis: if there is learning, expect positive • estimates for weight of risk equivalent) for • underestimated beliefs (fertility), and vice versa for • overestimated SPs (mortality and education) Data Literature: Manski, Charles F. "Measuring Expectations." Econometrica, 72, no. 5 (2004). Fischhoff, Baruch, Aandrew M. Parker, Wandi Bruine de Bruin, Julie Downs, Claire Palmgren, and Robyn Dawe. "Teen Expectations for Significant Life Events." The Public Opinion Quarterly 64, no. 2 (2000). Schwandt, Hannes. "Testing the Rational Expectations Hypothesis over Stages and States of Life: Micro Evidence from the German Socio-Economic Panel." In Universitat Pompeu Fabra Working Papers, 2009. I find substantial individual-level biases in the data: teenagers’ expectations are not fully accurate and homogenous as suggested by the REH. This implies models of behavior under uncertainty should relax their expectation assumptions and combine subjective probability data with observed choices to accommodate these forecast biases. The magnitude of the bias and amount of focal responses was very large for mortality and surprisingly small for education. This suggests the REH is more applicable in situation where the mechanism behind the outcome is clear. There is evidence of convergence for all three domains, suggesting there is a rational learning process. However, I could not establish many of the specific events that constitute the learning process. Finally, subjective probabilities possess predictive power, and certain anticipated events are included in this private information. • The NLSY97: Tracks transition to adulthood of • > 8,000 teenagers born between 1980-84; • Advantages: • Expectation elicited as integer b/n 0-100, making • a quantitative analysis possible; • Panel format allows to observe outcomes and • Expectations at an individual level • Limitations: • -Understanding of the question, especially mortality • -Focal responses • Subjective Probabilities (SP): • I analyze the responses to the following SP questions • asked to participants between ages of 15 and 20: • What is the percent chance that you will die (from • any cause …) between now and when you turn 20? • 2. What is the percent chance you will become • pregnant within 5 years? • 3. What is the percent chance you will be a student • in a regular school 5 years from now Acknowledgements: I would like to thank my advisor Dr. Frank Sloan, J. Alexander McMahon Professor of Health Policy and Management and Professor of Economics for his guidance and constructive criticism. I also extend my deepest gratitude to Dr. Kent Kimbrough, Professor of Economics and Instructor of the year-long Economics Honors Thesis Seminar, as well as my peers from said thesis seminar. • 4. Is there private information in SPs? • ___________________________ • OLS OF OUTCOME ON SP AND OP: • Ri = α+ βSi + γOi + ε • If objective subjective probabilities have no predictory • power, expect estimate of β = 0