Download
1 / 10

E N D
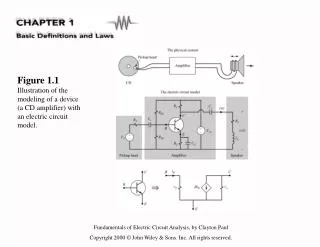
Figure 1. Compositional characterization of meso-HSiO1.5. A) FTIR spectrum showing characteristic SiH, SiOSi, and HSiOstretching modes from HSiO1.5 and residual SiOH from uncondensed silanol groups. B) 29Si HPDEC MAS NMR spectrum resolved into component T2, T3, Q3, and Q4 centers. C) Schematic representation of T and Q centers comprising the meso-HSiO1.5.
Figure 2. Structural characterizations of meso-HSiO1.5. A) SEM image, B) TEM image, C) SAXS diffraction pattern, and D) N2 adsorptiondesorption isotherms and DFT pore size distribution (inset) of meso-HSiO1.5.
Figure 3. Thermal transformation of meso-HSiO1.5 to meso-ncSi/ SiO2. Evolution of the Raman spectrum of meso-HSiO1.5 as a functionof heating from 300 to 1100 C under a slightly reducing atmosphere (5%H2/95% Ar).
Figure 4. Structural characterizations of meso-ncSi/SiO2. A) Evolution of SAXS pattern as a function of processing temperature. The SEM images afterprocessing at B) 900 C and C) 1100 C.
Figure 5. Structural characterizations of meso-ncSi/SiO2. HRTEM imaging of meso-ncSi/SiO2 processed at 900 C (A, C) and 1000 C (B, D, E) showing spherical morphology meso-ncSi/SiO2 particles with mesopores and ncSi. Focused-ion beam prepared cross sections (F) reveal ncSi with lattice fringes of 0.31 nm throughout the spherical mesoporous particles. The additional dark spots are due to ca. 1 nm Ga droplets from the FIB processing.
Figure 6. Optical properties of meso-ncSi/SiO2. PL and absorption spectra for meso-HSiO1.5 processed at 900 and 1000 C showing intense size-dependent emission at room temperature, consistent with quantum confinement in ncSi. The absorption spectra are vertically shifted for clarity.
Figure 2 . A,B) Optical microscopy images of a superhydrophilic pattern (photografted with AMPS) on a superhydrophobic porous polymer. Scale bars in (A) are 500 μ m and in (B) are 2 mm. The patterns were wetted with water making the hydrophilic areas more transparent. C) Water droplets onthe superhydrophobic microporous poly(butyl methacrylate- co -ethylene dimethacrylate) (left) and on the same surface after photografting with AMPS(right). D,E) Superhydrophilic patterns with different geometries and sizes filled with water dye solutions. F) Cross-sections of 200- μ m-wide superhydrophilicmicrochannels(photografted with AMPS) colored with a water solution of neutral red. Polymer films: 50- and 25- μ m-thick microporous poly(butyl methacrylate- co -ethylene dimethacrylate) films. Scale bars are 100 μ m.
Figure 3 . SEM images of the cross-sections of A,B) microporous and C,D) nanoporous poly(butyl methacrylate- co -ethylene dimethacrylate) films. Scale bars in (A,C) are 10 μ m and in (B,D) are 1 μ m.