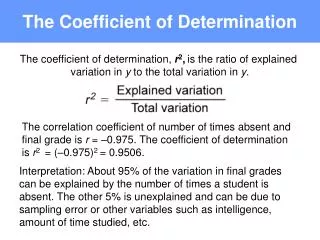
The Spatial GINI Coefficient
The Spatial GINI Coefficient. Dr. Paul C. Sutton Department of Geography University of Denver Population Assocation of America Conference San Francisco May 3 rd , 2012. Outline. Lorenz Curve and the GINI Coefficient as a measure of distribution of wealth

The Spatial GINI Coefficient
E N D
Presentation Transcript
The Spatial GINI Coefficient Dr. Paul C. Sutton Department of Geography University of Denver Population Assocation of America Conference San Francisco May 3rd, 2012
Outline • Lorenz Curve and the GINI Coefficient as a measure of distribution of wealth • Global gridded representations of Nighttime Satellite Imagery and Population Density as an alternative source for developing a spatially derived Lorenz Curve. • The Human Development Index (HDI)
Data Products Used Nighttime Lights of the World DMSP OLS (NGDC) LandScan Global Grid of Population
Scatterplots of Light vs Population for Pixels in China (left) and U.S. (right)
The Spatial GINI Coefficient II(also referred to as the “Lumen GINI”)
The “Real” Income GINI Coefficient Note: Research suggests the United States is on track to pass Mexico
Highly variable ‘freshness’ of Data Due to the lack of a systematic international data collection system, the data used to calculate income Gini coefficients span nearly two decades
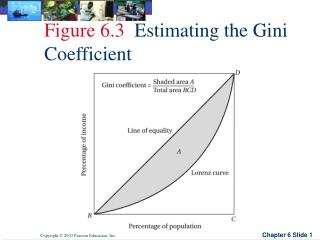
The Global Spatial GINI The Lorenz curve for the global Lumen Gini Coefficient, formed by combining the data from all countries.
Lorenz curves and Lumen Gini coefficients for six countries GINI = 0.941 GINI = 0.748 GINI = 0.981 GINI = 0.623 GINI = 0.542 GINI = 0.791
Spatial GINI vs. Income GINI National level Lumen Gini versus Income Gini coefficients. Note the poor correlation, indicating that the two Gini’s are measuring very different phenomena.
Spatial GINI vs Per Capita Energy Consumption and Electrification Rates
Discussion & Conclusions The Spatial GINI or Lumen GINI does not measure distribution of wealth in any manner similar to the Income GINI. The Spatial GINI correlates strongly and significantly with both the Human Development Index (HDI) and The Human Security Index (HSI). Simple, empirical measures such as the Spatial GINI as presented here present an opportunity for improved spatially explicit characterizations of the human condition.