Download

1 / 17
230 likes | 563 Views
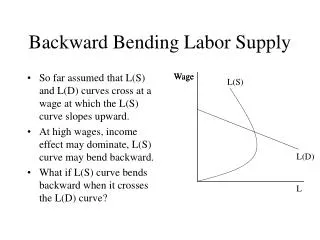
LORENZ CURVE AND GINI COEFFICIENT (animation: fly in). LIYANG LI May 31 st 2013. Income Distribution (animation: fly in). Income Distribution -The definition of the Income Distribution Lorenz Curve -The definition of the Lorenz Curve -The wealth gap in Canada

E N D
LORENZ CURVE AND GINI COEFFICIENT(animation: fly in) LIYANG LI May 31st 2013
Income Distribution (animation: fly in) • Income Distribution -The definition of the Income Distribution • Lorenz Curve -The definition of the Lorenz Curve -The wealth gap in Canada -How to solve the gap in rich and poor • Gini Coefficient -The definition of the Gini Coefficient -Calculation of Gini Coefficient • Reference (animation: split) PowerPoint 2013
Income Distribution • Definition: Income Distribution is a thing to describe how do a country’s total economy distribut by its population. • Income Distribution is a important elements of economic theory. And there are two famous methods used to measure the income distribution : Lorenz Curve and Gini Coefficient. Average family-adjusted after-tax income, by income group, Canada, 1976-2007 (2007 constant dollars)[1] PowerPoint 2013
Lorenz Curve • Definition: Lorenz Curve is a graph of curve to represent the proportionality in income distribution, usually. It can also be used to show distribution of assets. But most economists think that use Lorenz Curve to study income distribution is a measure of social inequality. • On the left side is a Lorenz Curve, it show us two different situations. Before we learn this two situations. There are two examples here. • If there is a county, a very equal society, no rich man or poor man. Everyone have the same wealth. 20% people of population have 20% wealth of society. 50% people of population have 50% wealth of society. • And if there is a county, everyone has inequality wealth. 1% people of population have 99% wealth of society. 99% people of population have 1% wealth of society. • so, how can we measure the gap of wealth? PowerPoint 2013
Here is a graph show the line of equality (which is the example a) and the Lorenz Curve (which is the example b). The x-axis is the percentage of population, the y-axis is the percentage of income. The degree of Lorenz Curve show the inequality in income. The degree increasing represent gap become more big, more inequality. Otherwise the situation is completely the opposite. Y A B X In common, a country’s income distribution is completely equal or inequality, it usually between two situation. There is a area A which is between the Lorenz Curve and line of equality. And the area B which is between the OXH and Lorenz Curve plus the area A, the whole area under the line OH which is A+B. The area ratio between the A and the A+B , we called it “Gini Coefficient”. Gini Coefficient is a measurement criteria to measure the gap of wealth, we will learn it later. PowerPoint 2013
Why we have wealth gap? There are many reasons for economic inequality within societies. These causes are often inter-related. Acknowledged factors that impact economic inequality include[2]: • the labour market • innate ability • education • computerization/growing technology • economic neoliberalism • globalization • race • gender • culture • wealth condensation • development patterns • personal preference for work, leisure and risk • destruction of progressive taxation Recent years in Canada, the wealth gap is become a big problem affect the social development. Especially in some developed area like Toronto, Vancouver and BC, etc. Wealth gap make a lot of trouble in these area , like violent crime become more and more frequent, poor families are hard to find any living space, and the healthy problem, even some mental illness. Unfortunatly, Canada has the highest crime rate in developed countries. That is very emergence problem need to be solved, so how we deal with these problems? PowerPoint 2013
Solve the gap in rich and poor: 1) We need to improve the labour market, decrease the unemployment rate, hire more people for wokring. 2) We need to improve our education system, give next generation a right direction, more useful abilities. 3) We need to develop the technology, increase our productivity. 4) Decrease the tax rate for low income people, provide them some special benefits. 5) Strengthening charity promotion, let rich people donate more for the society. 6) Increase amount of lowest income. In Canada, there are a lot of resource, I think the government supposed to appropriate use these to increase the GDP, also decrease the unemployment rate. In last year, Canada’s wealth gap increased. For example, in the Chinese markets, the price of Chinese goods increase a lot, because in the one hand, the food in China increase, on the other hand, more and more Chinese markets have a lot compete. The exchange rate of Canada dollar and US dollar increase near 10%, GPD decrease more than 3%, unemployment rate more than 7%. PowerPoint 2013
Canada government how to solve this gap in rich and poor There is a meeting in Toronto last month, Toronto’s Former Mayor and senator Art Eggleton wrote a report < In From the Margins: A Call to Action on Poverty, Housing and Homelessness > with another senator Hugh Segal about the situation in Canada, and this meeting in last month, the point is to discuss about the problem in Toronto, Eggleton said: no Canadian should live below the poverty line, Canada need make a blue print for anti-poverty. Huge gap between rich and poor has become more and more to social inequality, pose a huge threat to social cohesion. However, from the current situation, most provinces have developed a program of anti-poverty strategies, but the federal government has not taken action. Toronto City Council, Committee of low-cost housing, Ms. Ana Bailao said: Toronto need strong partnerships to the prosperity of our city. In this meeting, people from all regions to bring their energy and creativity, as poverty, housing and homelessness solutions, this is a good start. President and CEO Susan McIsaac mentioned, community decline and a decrease in investment is the impact on the future prosperity of Toronto, a huge risk factor. In addition, other non-government and government from the representatives of the meeting also made recommendations to the Government. Government officials said the deputies will be observations and recommendations of the report this spring to the low-cost housing committee, the committee will consider recommendations to the City Council. Information come from[3], summarized by me. PowerPoint 2013
Here is some countries' Gini Coefficient in 2010 , as we know, we usually divided the graph in 5 parts, and each part is 20%.[4] PowerPoint 2013
Example : Here is a country, there are 6 people get 1000$ salary per month, 5 people get 2000$ salary per month, 3 people get 3000$ salary per month, 2 people get 4000$ salary per month, 1 people get 5000$ salary per month. Obviously 1000$ per month is the lowest salary, 6 people, 40% of population, 20% of total income; next one is 2000$ per month, 5 people, 33.33% of population, percentage in all is 73.33% (40%+33.33%). 33.33% of total income, percentage in all is 53.33% (20%+33.33%), etc. So if we connect all the point in the graph, we can get a curve which is Lorenz Curve: PowerPoint 2013
If you want calculate and get a function , I suggest you use a software called excel , otherwise it is easy to make mistakes. PowerPoint 2013
Gini Coefficient: Gini Coefficient is developed by Italian statistician and nd sociologist Corrado Gini. It is a ratio between 1 and 0. It is used to measure the people’s income gap. Gini Coefficient is usually defined mathematically based on the Lorenz Curve. In this graph[5], line A is a special situation, called line of perfect equality, in this situation everyone has the same wealth. Line B reperesnt a inequality situation, everyone has different wealth. Line c is a line of perfect inequality, this means only one person have the all wealth. C PowerPoint 2013
We mentioned before about Gini Coefficient. In common, a country’s income distribution is completely equal or inequality, it usually between two situation. There is a area A which is between the Lorenz Curve and line of equality. And the area B which is between the OXH and Lorenz Curve plus the area A, the whole area under the line OH which is A+B. The area ratio between the A and the A+B , we called it “Gini Coefficient” ( G = A / ( A + B ) ). Gini Coefficient is a measurement criteria to measure the gap of wealth. Y A If A = 0, Gini Coefficient is 0, it means it is perfect equality. If B = 0 , the coefficient = 1, that is perfect inequality. More equality of income, the degree of the curve will more low. B X PowerPoint 2013
Calculation Gini Coefficient: Y A B X PowerPoint 2013
Gini Coefficient sections[7] Usually, we use 0.4 as a “Trigger Level”, it come from the Golden Section, actually it is equal 0.382, justapproximate to 0.4. The developed countries’ Gini Coefficient is between 0.24 to 0.36, America is 0.4, China had bigger than 0.5 in 2010, income distribution in China is quite inequality. If there is a gap in income. The government should change the tax rate to control the income distribution. PowerPoint 2013
Average after-tax income of families by quintiles, for years 2007, 2002 and 1998 in Canada[8] PowerPoint 2013
References: [1]: page 3 http://www4.hrsdc.gc.ca/.3ndic.1t.4r@-eng.jsp?iid=22 [2]: page 6 http://en.wikipedia.org/wiki/Economic_inequality [3]: page 8 http://news.yorkbbs.ca/local/2011-03/444054.html [4]: page 9 http://www.statcan.gc.ca/pub/75-203-x/00002/4153424-eng.htm [5]: page 12 http://baike.baidu.com/view/186.htm [6]: page 14 http://baike.baidu.com/view/186.htm [7]: page 15 http://baike.baidu.com/view/186.htm [8]: page 16 http://www.statcan.gc.ca/pub/75-202-x/2007000/t065-eng.htm Some information may come from the internet , but I use my own word to express them. PowerPoint 2013