Download
1 / 49
490 likes | 618 Views
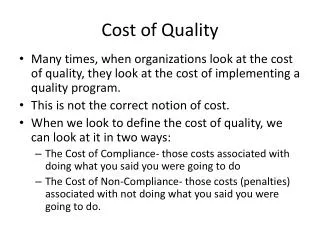
Cost of Quality Childcare Survey Analysis February 2012. Overview. Section 1: Staff Salaries and Benefits Number of staff, average hours worked/week, hourly wage, annual salary Substitute teacher use and cost, total amount spent on supervision

E N D
Overview • Section 1: Staff Salaries and Benefits • Number of staff, average hours worked/week, hourly wage, annual salary • Substitute teacher use and cost, total amount spent on supervision • Healthcare, Unemployment Insurance, and Fringe Benefits • Section 2: Professional Development • Courses/programs, materials, staffing costs, release time
Overview • Section 3: Occupancy Costs • Quality of space, geographic location, tenure status • Occupancy costs, upkeep, subsidized costs/services • Section 4: Curriculum and Assessment • Spending on curriculum materials and assessment tools • Hours devoted to curriculum preparation and administering/scoring student assessments
Overview • Section 5: Classroom Materials • General classroom expenses, new or used purchases • Personal care, food-related, computer-related expenses • Janitorial services, cleaning-related duties • Section 6: Other Expenses • Other miscellaneous expenses • Parent outreach/involvement
Respondent Profile • 379 respondents (after removing all duplicates, incomplete or invalid responses) • 22.8% response rate • Program classifications • 57% center-based or school-based programs • 36% family child care programs • 7% after-school or out of school time programs • Enrollment by age group • Infants: average 5.5 enrolled, median 3 • Toddlers/preschool: average 35.8 enrolled, median 19 • School-age: average 40.4, median 8.5
Section 1: Staff Salaries and BenefitsNumber of Direct Service Staff • For the director and assistant director positions, a strong majority of respondents employ just one staff member. Conversely, half of respondents indicated that between two and 11 staff members are employed in the teacher position, with a group average of approximately nine teachers on staff.
Section 1: Staff Salaries and BenefitsHours Worked Per Week • Directors, assistant directors, and teachers were most likely to work full time (40 hours per week) or close to it, while assistant teachers, classroom support, and administrative support typically appeared to work on a part-time basis.
Section 1: Staff Salaries and BenefitsHourly Wage • Respondents reported higher average hourly wages for administrative support and directors, followed by classroom support and assistant directors.
Section 1: Staff Salaries and BenefitsAverage Hourly Wage • Some of the highest average hourly wages are observed for administrative support in central city locations and after-school programs ($24.30 and $24.04) as well as directors in town locations and center-based or school-based programs ($22.86 and $22.16). Some of the lowest average hourly wages were for assistant teachers in rural settings and family child care programs, as well as assistant directors in family child care programs.
Section 1: Staff Salaries and BenefitsAnnual Salary • Again, the highest average salaries, as demonstrated by the group mean and median, were observed among directors and administrative support staff.
Section 1: Staff Salaries and BenefitsAverage Annual Salary • Administrative support staff and directors are among the highest paid, most notably in after-school programs and family child care programs (administrative support), center-based or school-based programs (directors), and central city locations (highest for all positions).
Section 1: Staff Salaries and BenefitsSubstitute Teacher Use and Cost • Responses varied for the average number of days substitutes were used: the group median was 20, while the group average was 54. Conversely, over half of respondents indicated that the average cost of a substitute for one day of work was between $50 and $96, with a group median and mean of $72 and $78, respectively.
Section 1: Staff Salaries and BenefitsSupervision Spending • Total spending on supervision • Mean: $110,397 • Median: $34,000 • Mid-50%: $5,000-$100,000
Section 1: Staff Salaries and BenefitsBenefits • Teachers and directors were the most likely to receive all three types of benefits, and healthcare benefits tended to be the most common benefits received across the board.
Section 1: Staff Salaries and BenefitsBenefits • The highest average amounts were spent on healthcare benefits for teachers, fringe benefits for classroom support, and fringe benefits for teachers. Overall, unemployment insurance benefits had the lowest average annual amounts across all position categories.
Section 1: Staff Salaries and BenefitsAverage Total Benefits • Facilities based in central city locations had the highest total amounts for all benefits, most notably fringe benefits ($87,815) and health benefits ($66,661). The lowest average total benefits appear to be centered on unemployment benefits, which had some of the lowest total amounts overall, and among programs in rural locations.
Section 2: Professional DevelopmentSpending • Teachers and directors were the most likely to benefit from spending on professional development courses and/or programs (based on number of respondents – see accompanying report). Overall, spending on professional development courses and/or programs appears to be highest for classroom support staff and teachers.
Section 2: Professional DevelopmentSpending • Again, teachers and directors were the most likely to benefit from spending on professional development materials (based on number of respondents – see accompanying report). On average, teachers received the highest average amounts of spending on professional development materials, while the values were generally comparable across the other four direct service positions.
Section 2: Professional DevelopmentSpending • Of the five categories, the most common type of professional development for which spending was reported was “professional development for licensing requirements” (count shown in accompanying report), while the highest group mean was for “college-level courses.”
Section 2: Professional DevelopmentStaffing Costs • When asked to indicate how much their facility spends each year on instructors hired to teach professional development courses, half of the 114 respondents who answered this question provided a response of between $300 and $1,875, with a group mean of $2,393. • When asked how much their facility spends each year on staffing costs associated with covering staff who are participating in professional development courses or programs, half of the 97 respondents reported spending between $300 and $2,000 for these staffing costs, with a group mean of $1,819.
Section 2: Professional DevelopmentRelease Time • When asked about the number of hours available in professional development release time each year for direct service staff, all positions received roughly similar amounts of release time, with classroom support staff and teachers receiving a few more days for professional development, on average.
Section 2: Professional DevelopmentAverage Total Spending and Release Time • Some of the highest average costs were in central city locations (courses/programs and other costs) and among after-school or out of school time programs (other costs). Professional development materials appear to have very low levels of spending, most notably among rural and town locations and family child care programs. Central city locations appear to allow for the most professional development release time, while rural locations seem to allow the least.
Section 3: Occupancy CostsQuality of Space • Class A buildings are the most prestigious buildings competing for premier office users with rents above average for the area. Buildings have high quality standard finishes, state of the art systems, exceptional accessibility and a definite market presence. • Class B buildings compete for a wide range of users with rents in the average range for the area. Building finishes are fair to good for the area. Building finishes are fair to good for the area and systems are adequate, but the building does not compete with Class A at the same price. • Class C buildings compete for tenants requiring functional space at rents below the average for the area.
Section 3: Occupancy CostsGeographic Location • The most common response was “town,” at 42.9 percent of respondents, followed by “central city” at 29.1 percent.
Section 3: Occupancy CostsTenure Status • Own: tenant is the sole owner of all facility properties • Rent: a short-term agreement with a landlord that can be changed or amended on a regular basis • Lease: a long-term contract with a landlord renting land and buildings to a tenant
Section 3: Occupancy CostsUtilities • Lessees and renters had higher mean values for utilities than owners, at $18,547 and $17,884 in annual costs, respectively.
Section 3: Occupancy CostsClassroom Play Spaces/Environments • Renters had the highest mean values for spending on classroom play spaces and environments, while owners had the lowest mean value.
Section 3: Occupancy CostsSubsidized Costs/Services • Renters and lessees were asked if rent, utilities, or repair, renovation, and maintenance services were subsidized for or donated to their facility. The most common item (23.3 percent of respondents) to be subsidized or donated to lessees was repair, renovation, and maintenance services. Conversely, rent and repair, renovation, and maintenance services were subsidized or donated to nearly one-fifth of renters. Populations include 52 renters and 69 lessees.
Section 3: Occupancy CostsAverage Total Occupancy Costs • Owners have some of the lowest overall costs in all cases except among after-school programs. Conversely, renters and lessees had the highest total occupancy costs, especially among center-based or school-based programs and in central city locations.
Section 4: Curriculum and AssessmentSpending • Typical spending was considerably higher for curriculum materials than for assessment tools, and the group mean for curriculum materials was more than double the group mean for assessment tools.
Section 4: Curriculum and AssessmentHours Devoted to Curriculum Preparation • In general, it appears that directors, assistant directors, and teachers all dedicate approximately the same amount of time to curriculum preparation (average of around eight hours each week) while assistant teachers devote an average of 5.3 hours each week.
Section 4: Curriculum and AssessmentHours Devoted to Assessments • The mean value for assistant directors was highest at 5.3 hours each week, followed by teachers (5.1 hours) and directors (4.8 hours).
Section 4: Curriculum and AssessmentAverage Spending and Hours Devoted • For spending, central city facilities had the highest average total amount, while family child care programs spent the least on average. Greater amounts of time were typically devoted to curriculum preparation in after-school or out of school time programs and in central city locations, while much less time was devoted to administering and scoring student assessments in after-school or out of school time programs and in family child care programs.
Section 5: Classroom MaterialsSpending • Art materials received the highest group mean spending amount, followed by materials to support language and literacy and materials for gross motor development. Interestingly, the group medians for all classroom expenses (excluding art materials) were between $173 and $250, indicating that the middle ranges of values for all expenses were somewhat similar.
Section 5: Classroom MaterialsUsed or Second-Hand Purchases • Over half of respondents purchased less than 10 percent of these classroom materials second-hand or used. Childcare providers that purchased more than 75 percent of these items second-hand or used constituted just 6 percent of the sample.
Section 5: Classroom MaterialsPersonal Care Routines • Annual spending on cots and bedding typically ranged from $100 to $500, with a group average of $891, making it the least costly material related to personal care routines. Toileting and diapering was the most expensive, with half of respondents indicating that their facility spent between $150 and $1,000, and a group average of $1,563.
Section 5: Classroom MaterialsFood-Related Expenses • The most costly food-related expense appeared to be the cost of staff to provide food, which had a group average of $20,323. Although just 65 respondents indicated that this expense was applicable, half of those respondents reported paying between $2,000 and $20,462. Snacks were the least costly food-related expense, which cost half of respondents between $1,000 and $5,000 and had a group average of $4,950.
Section 5: Classroom MaterialsFood Allowance from CACFP • A total of 148 respondents indicated that they do receive a food allowance from the Child and Adult Care Food Program (CACFP), which amounts to 56 percent of respondents who answered this question. The amount received typically ranged from $300 to $23,250, and the group average of $26,749 suggests that there were several facilities receiving very large amounts from CACFP.
Section 5: Classroom MaterialsComputer-Related Expenses and Office Supplies • Although budgets for office supplies appeared to be somewhat higher than the three types of computer-related expenses overall, the group average for IT support is by far the highest of the four, most likely because of several facilities budgeting very large amounts of funding for this expense.
Section 5: Classroom MaterialsAverage Total Spending • The highest amounts of spending tended to be in central city locations and center-based or school-based programs, especially for food-related and computer-related expenses. The lowest amounts of spending were in the areas of personal care spending (especially family child care programs, after-school programs, and rural locations) and computer-related expenses (specifically in family child care programs and town-based facilities).
Section 5: Classroom MaterialsJanitorial Services and Spending • When asked if their facility employs a janitor or contracts with a janitorial service, slightly over half of respondents answered affirmatively (132 “yes” versus 129 “no”). Facilities that use a janitor or janitorial service budget a considerably higher amount for these services than facilities without janitorial services spend on cleaning supplies.
Section 5: Classroom MaterialsAverage Spending on Janitorial Services and Cleaning • After-school or out of school time programs and central city-based facilities appeared to spend the most on janitorial services, while center-based or school-based programs and rural-based facilities spent the most on cleaning supplies.
Section 5: Classroom MaterialsCleaning-Related Duties • Directors and teachers were most likely to perform any cleaning-related duties (count of responses not shown here). Interestingly, all four direct service positions typically spent the same amount of time performing these duties: across all job categories, the middle-50 percent of responses were in approximately the same range. The group means, however, indicated that teachers and directors may have spent more time performing cleaning-related duties.
Section 6: Other ExpensesMiscellaneous Spending • The widest middle 50-percent ranges of values were provided for transportation and administrative office supports, and the highest group means were for administrative office supports, transportation, and licensing fees.
Section 6: Other ExpensesParent Outreach and Involvement • The highest group median value was for parent nights ($400), while the highest group mean was for home visits ($3,300).
Section 6: Other ExpensesParent Outreach and Involvement • Both parent outreach/communications and “other spending,” which includes items such as advertising, accountants, and transportation, were highest in central city locations and in center-based or school-based programs, and were lowest at family child care programs.