Download
1 / 19
190 likes | 351 Views
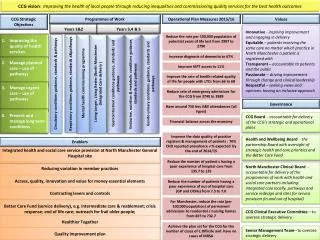
Improving quality of the Childcare Workforce. Social mobility and life chances Oxford. Kathy Sylva University of Oxford. This presentation will explore. Impact of pre-school Effects of quality of pre-school provision on children Staff qualifications and their effect on children’s learning.

E N D
Improving quality of the Childcare Workforce Social mobility and life chances Oxford Kathy Sylva University of Oxford
This presentation will explore Impact of pre-school Effects of quality of pre-school provision on children Staff qualifications and their effect on children’s learning
Effective Provision of Pre-School EducationE P P E Kathy Sylva University of Oxford Edward Melhuish Birkbeck, University of London Pam Sammons Institute of Education, University of London Iram Siraj-Blatchford Institute of Education, University of London Brenda Taggart Institute of Education, University of London Karen Elliot Institute of Education, University of London 1997-2003, 2003-2008
Questions explored in the EPPE research • What is the impact of pre-school on young children’s intellectual and social/behavioural development? • Are some pre-schools more effective than others? • Can pre-school experience reduce social inequalities? • What is the effect of workforce qualifications on children’s development?
Sample • Six local authorities • 141 Pre-school centres randomly selected within the authorities to include: • nursery classes • playgroups • private day nurseries • day care centres run by local authority • nursery schools • fully integrated centres • Approx 2,800 children from 141 centres and 300+ ‘home’ children
Plan of Study Reception Year 1 Year 2 (5 yrs) (6 yrs) (7 yrs) Pre-school Provision (3+yrs) 25 nursery classes 590 children Baseline Assessment N= 3,000+ Exit Assessments N= 1500 Age 6 Assessments N = 3,000+ Age 7 Assessments N= 3,000+ 34 playgroups 610 children 31 private day nurseries 520 children 20 nursery schools 520 children 24 local authority day care nurseries 430 children 7 integrated centres 190 children home 310 children
Child Assessments at entry to the study (age 3.0 years to 4 years 3 months) • Cognition British Ability Scales • Language British Ability Scales • Social and behavioural development Cooperation/conformity, peer sociability, anti-social or ‘upset’ behaviour.
Child Assessments at entry to school (age 4+ to 5+ years) • Cognition British Ability Scales • Language British Ability Scales • Numeracy Early number skills • Literacy skills Letter recognition, phonological awareness • Social/behavioural development Cooperation, peer sociability, independence/concentration, anti-social or ‘upset’ behaviour.
Sources of data • Child assessments over time • Family background information • Interviews with staff • ‘Quality’ rating scales • Case studies of effective centres
Measuring Value Added • Multilevel models established the extent to which the pre-school centre influenced children’s progress. • Children’s progress was assessed controlling for prior attainment at age 3+. • Child, parent, & home learning environment factors were included in the analyses. Child Measures controlled for: • gender • ethnicity • number of siblings Family Measures controlled for: • eligibility to FSM • mother’s highest level of qualification • highest social class
Measuring Value Added continued Home Learning Environment Measures • frequency reading to child • frequency of library visits • frequency child paints/draws at home • frequency parent teaches letters/numbers • frequency parent teaches the alphabet • frequency parent teaches songs, nursery rhymes, etc Other Measures • length of time in months spent in pre-school
Does type of pre-school experience matter? • Integrated centres and nursery schools are best for cognitive outcomes. • Integrated centres, nursery schools and nursery classes are best for social outcomes.
The impact of quality How EPPE measures quality • Early Childhood Environment Rating Scale (ECERS-R total + subscales) • ECERS-E (total + subscales) • Caregivers Interaction Scale (4 subscales, e.g., punitiveness, detachment)
Staff qualifications and children’s learning • % staff time at different levels (unqualified, level 2, level 3 & 4 and level 5*) was tested in models. • For cognitive progress, % staff contact time at level 5 was positive significant for outcome (pre-reading). • For social behavioural development: % staff contact time at level 5 was positive significant for ‘Co-operation & Conformity’ and also significantly associated with reductions in ‘Anti-social / Worried’ behaviour * Level 5 = degree level teacher (QTS)
After taking into account the impact of child, family, home environment characteristics…at the end of year 1 • children from high quality pre-schools had higher reading attainment • children from pre-school centres with high ECERS-R subscale scores showed fewer Conduct problems • qualified teachers made a difference in children’s academic and social outcomes
A ‘take-home’ message? • Children who stayed at home were more likely to be identified as ‘at risk’ at the beginning of school than children who had attended some type of pre-school. • A pre-school of high quality can help children move out of cognitive risk by the start of primary school. • This positive impact remains evident at least until the end of Year 2. • The higher the staff qualifications, especially QTS, the more developmental progress children make in the pre-school period.
For further information on EPPE • Sammons, P., Sylva, K., Melhuish, E., Siraj-Blatchford, I., Taggart, B & Elliot, K. (2002). Technical Paper 8a: Measuring the Impact of Pre-School on Children’s Cognitive Progress over the Pre-School Period. Institute of Education, London. • Sammons, P., Sylva, K., Melhuish, E., Siraj-Blatchford, I., Taggart, B & Elliot, K. (2003). Technical Paper 8b: Measuring the Impact of Pre-School on Children’s Social/behavioural Development over the Pre-School Period. Institute of Education, London. • Sammons, P., Smees, R., Taggart, B., Sylva, K., Melhuish, E., Siraj-Blatchford, I., Elliot, K. (2004). EYTSEN Technical Report No.2. Institute of Education, London. • Sammons, P., Taggart, B., Smees, R., Sylva, K., Melhuish, E., Siraj-Blatchford, I., & Elliot, K. (2003). The Early Years Transition and Special Educational Needs (EYTSEN) Project. DfES Research Report 431. • Sylva, K., Melhuish, E., Sammons, P., & Siraj-Blatchford, I. (2004). Effective Pre-school Education. DfES Research Report. visit the EPPE website: http://www.ioe.ac.uk/projects/eppe
For further Information about EPPE visit the EPPE website at:http://www.ioe.ac.uk/projects/eppe