Optimizing Citrus Grove Management with EMI Instrumentation
Explore the spatial and temporal variability of soil conductivity and water tables to enhance citrus grove profitability through precise irrigation and drainage. Study conducted in two Florida groves utilizing advanced soil sensing technologies.


Optimizing Citrus Grove Management with EMI Instrumentation
E N D
Presentation Transcript
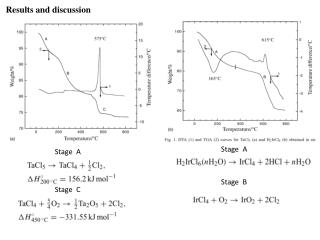
Introduction • Florida citrus growers currently manage their groves as uniform production units, but considerable variability in various grove characteristics may exist (Fig. 1). Recent results show that soil and groundwater variability are dominant factors affecting in-field variability and profitability of citrus (Schumann et al., 2002).Spodosols in south-central Florida have sand or fine-sand textures, and silt plus clay content is less than 5% except in the Bh (spodic) horizon (Fig. 2). These soils typically have shallow water tables, caused by perching of water above the Bh horizon (Hyde and Ford, 1989). Minimal vertical saturated flow capacity in the Bh horizon causes ponding into the overlying E and A horizons. Water logging may develop all the way to the surface (Cox and McFarlane, 1995) and can damage the root systems of citrus trees. OBJECTIVES: • Determine the best operating conditions of a commercial electromagnetic induction (EMI) soil sensing device and calibrate it for use in estimating shallow water table depths from apparent conductivity (ECa). • Examine the spatial and temporal variability of soil ECa and water table data to determine the accuracy and repeatability of water tables measured by EMI. • Use the validated EMI instrument together with DGPS to make automated in-field soil water table depth measurements which can be mapped and used in precision agriculture for improving citrus grove management and profitability through optimized drainage, fertilization and irrigation. Methods Results & Discussion • Two variable field sites: Revell and Varner groves, located near Bowling Green, Hardee Co., Florida (27.63089oN, 81.82467o W). • Revell grove has no artificial drainage and is planted with a mixture of mature ‘Hamlin’ and ‘Valencia’ oranges at an elevation of 33.5 to 38.1 m above mean sea level (msl), with dimensions of 789 m E-W, 712 m N-S (Fig. 1). • Varner grove has artificial drainage (double beds and ditches) and is planted with mature ‘Hamlin’ oranges at an elevation of 30.5 to 34.0 m above msl, with dimensions of 402 m E-W, 806 m N-S (Fig. 1). The horizontal distance between the two groves is 12.3 km. • Fifty water table observation wells were installed during the dry season in each grove (Fig. 1). • Wells were1.5-m long, 10-cm diameter PVC pipe, perforated with 2.5-cm holes in the lower 1.1-m section and covered with nylon drain sleeve to prevent soil entry. • Collected soil samples at 0-15, 15-30, 30-60, 60-90, 90-120, 120-150 cm depths for soil electrical conductivity (EClab) measurements in the laboratory. • Ground conductivity measurements (ECa) were taken with an EM38 electromagnetic soil profiler (Geonics Limited, Mississauga, Ontario, Canada) at each well when the water table was measured. • Both horizontal dipole (EMh) and vertical dipole (EMv) orientations. • Motorized ground conductivity surveys were performed in each grove with the EM38 instrument mounted vertically on a specially constructed acrylic sled (Fig. 3). • EM38 was towed 5-m behind a four-wheel drive vehicle equipped with a Trimble 106 Differential Global Positioning System (Trimble Navigation Limited, Sunnyvale, CA). • Ground speed of the sled was about 5 m/s, which translates to an ECa distance resolution of about 5 m at 1 Hz averaged data rate. • 50 water table depths per grove and the corresponding ground conductivities (ECa) were analyzed by regression with Genstat statistical software (Genstat 5, Lawes Agricultural Trust, Rothamsted, UK) to obtain calibrations for predicting water table depths from ECa readings. • The accuracy of water table depths predicted from EMv was estimated from the root mean square error (RMSE) of the regressions. • Survey data files of DGPS and EMv readings were imported into ArcView GIS software (ESRI, Redlands, CA) for calculation of water table depth and mapping. • Regular gridded XYZ data surfaces were interpolated from the calculated water table depth data using point kriging and eight search sectors with the Surfer 7 software (Golden Software Inc., Golden, CO). MANUAL MEASUREMENTS • Ground conductivities measured with the EM38 over five dates at comparable water table depths were consistently higher in the Varner grove than the Revell grove (Table 1; Fig. 4). These trends could be attributed to the higher EClab values in the Revell grove (Table 1). • Different measurement dates provided a wide temporal range of water table conditions in the groves (Table 1) and yielded different calibrations (Table 2; Fig. 4). • Correlations between water table depth and ECa ground conductivities were consistently higher when measured in the deeper sensing vertical dipole mode (EMv) than the horizontal dipole mode (EMh). • A logarithmic regression resulted in a slightly better fit than a linear regression, probably due to the nonlinear response of the EM38 instrument (Table 2). • The accuracy of these regression calibrations for water table depth prediction was estimated by the RMSE and ranged from 4.1 to 15.5 cm over the different dates and groves (Table 2). • Due to the higher soil solution conductivity (EClab) in the Varner grove, the regression models for water table depth and EMv in the two groves were significantly different even on the same day (Table 2; Fig. 4). • The semivariograms for EClab, EMv and water depth for both groves were best fitted by the spherical model. • The semi-variance attained its maximum at a range of influence of about 250 m in the Revell grove and 650 m in the Varner grove. This indicated the presence of spatial dependence for soil and water table depth parameters within both groves (Table 3). AUTOMATED (SURVEY) MEASUREMENTS • The Revell grove survey collected 5438 georeferenced EMv values, at a mean speed of 4.50 m/s, taking 108 min to complete 45.2 ha (25.1 ha/h). The Varner grove survey collected 3553 georeferenced EMv values, at a mean speed of 4.43 m/s, taking 83 min to complete 26.8 ha (19.4 ha/h). • The raw EMv survey data from the groves were used to predict five water table depth classes (Fig. 5) using site-and-time-specific calibrations (Table 2). • Final water table maps after interpolation by kriging and smoothing showed large spatial variability similar to that observed across the 100 manually measured wells (Fig. 6). • Two large zones of deeper water table depths roughly corresponded to the location of the Jonathan sand soil series (Figs. 1 & 6). • In contrast, the Zolfo fine sand and Sparr fine sand corresponded to the shallower water tables in Revell grove (Figs. 1 & 6). • In the Varner grove, deeper water tables were found in the Pomello fine sand area, occupying most of the northern half of the survey area, while the shallower water tables occurred in the Immokalee fine sand (southern half), and Ona fine sand / Placid fine sand zones (northeast corner) (Figs. 1 & 6). • precautions should be taken during surveys to avoid metal objects such as cans, buried pipes, and adjacent buildings, pumps or fences in the route because erroneous ECa readings were obtained in their proximity. Electrolyte concentrations in the soil and soil solutions could also greatly affect the EMI results, thus strongly biasing the calculated water table depths. • In order to ensure the best possible water table prediction, we therefore recommend that a site-specific calibration between EMv and water table depth be conducted on each large contiguous block of land at each given time only. b) a) Figure 4.Calibration curves developed for predicting water table depth from EMv on five dates in a) the Revell grove and b) the Varner grove. Figure 6.Interpolated water table depths predicted from EMv ground conductivity measurements collected by sled-mounted EM38 and DGPS in a) the Revell and b) the Varner groves. Summary a) Figure 5.Water table depths in the Revell grove predicted from 5438 EMv ground conductivity measurements collected by sled-mounted EM38 and DGPS. Efficient drainage is an important prerequisite for economic citrus production on southern flatwoods soils in Florida because their shallow water tables can limit root development, stunt tree growth and contribute to mortality. The objective of this study was to develop a new precision agriculture application, using ground conductivity measured with the EM38 electromagnetic soil profiler for the estimation and mapping of shallow water table depths in Florida’s citrus groves. Calibrations were developed and tested in five different months and two sites to evaluate the spatial and temporal accuracy of water table predictions. Three automated mobile surveys of water table depth were then conducted in the same groves using a differential global positioning system (DGPS) for georeferencing the ground conductivity data. The spatial variability of water table depths was mainly influenced by soil type and the temporal variability was influenced strongly by the seasonal rainfall pattern. The vertical dipole (EMv) of the EM38 instrument was better than the horizontal dipole (EMh) for estimating water table depths because of its greater sensing depth. Accuracy, calculated as root mean square error (RMSE), ranged from 4.1 to 15.5 cm on a given day. Keywords: EM38, precision agriculture, GIS, DGPS, hydromorphic soils, water table a) Selected References Cox. J.W., and D.J. McFarlane. 1995. The causes of water logging in shallow soils and their drainage in southwestern Australia. J. Hydrology. 167: 175-194. Hyde, A.G., and R.D. Ford. 1989. Water table fluctuations in representative Immokalee and Zolfo soils of Florida. Soil Sci. Soc. Am. J. 53:1475-1478. Schumann, A.W., T.A. Wheaton, and J.D. Whitney. 2002. In-Field Soil Variability Affecting Productivity of Florida Citrus Groves –– A Precision Agriculture Application. ASA Southern Branch Annual Meeting, Orlando, FL. b) Figure 3.Acrylic sled with dust cover, EM38 instrument, and typical field survey configuration with four-wheel drive vehicle. Acknowledgements * Support for this research was received from USDA-IFAFS grant No. 2001-52103-11323 Maintaining the Competitiveness of Tree Fruit Production Through Precision Agriculture and a donation from Cargill Fertilizer. The authors would also like to thank the assistance and contribution from Tom Pospichal, Kevin Hostler, Adair Wheaton, Jodie Whitney, Gerald Perkins, Stuart Pocknee and John Roegner during the field instrumentation and data collection phases of this project. b) Figure 1.Aerial photographs of a) the Revell grove and b) the Varner grove showing locations of fifty observation wells, elevation contours, soil series, and the survey boundaries for this study. Figure 2. Example of a Florida Spodosol Using Electromagnetic Induction Methods to Map Groundwater in Florida Citrus Soils A.W. Schumann* and Q. Zaman, University of Florida / IFAS, Citrus Research and Education Center, 700 Experiment Station Road, Lake Alfred, FL AWS, 23 October, 2003